Introduction
At the global level, the most common causes of death are ischemic heart disease followed by cerebrovascular disease [1]. Colombia, where these issues are prevalent in the population above 60 years old [2], is not an exception [3], [4]. Diabetes and arterial hypertension are chronic diseases requiring treatments through medicines that have to be provided throughout the life of the patient. Therefore, the accessibility of medicines is relevant to the prevention and treatment of these diseases, whose indirect costs to the national health system were about 13.2 billion COP in 2015 [5].
Among the challenges that companies must face in order to be competitive, globalization, increased costs, uncertainty in demand, and improvement in the delivery of products and services have received considerable attention [6]. One of the means to face these challenges is the development of collaborative planning models, which are intended to coordinate decisions and solve supply chain inconveniences regarding inventories, resupplies, product placement, and order delivery, as shown in [7].
This paper focuses on the definition of a collaborative approach to a network for the distribution of diabetes and arterial hypertension medicines from a health insurance company to a healthcare provider. Therefore, certain agreements were explored between the two entities, with the purpose of enhancing the medicine distribution process by means of joint decision planning. For this purpose, and focusing on hypertensive and diabetic patients over 60 years of age, a CPFR model was adapted to the current distribution network and included in the collaboration agreements, together with a series of amendments: The evaluation of the convenience of allocating new facilities, the estimation of the medicine amounts to be delivered, and the definition of their distribution routes.
Collaborative Planning Models
There are different types of collaborative planning models. In the first place, as affirmed by Calderón and Lario [8], the Supply Chain Operations Reference (SCOR) model associates different elements such as business processes, metrics, good practices, and technology within a unified structure intended to improve the management of the supply chain towards the fulfillment of goals and expectations. In the second place, the Supply Chain Planning (SCP) matrix aims to group all the tasks involved in collaborative planning under two different concepts, namely planning horizon and supply chain processes, in order to provide an adequate management, as shown in [9]. In the third place, the Collaborative Planning Forecasting and Replenishment (CPFR) model, which originated from the cooperative planning relation established between Wal-Mart and Warner-Lambert in 1995 [10], allows all participants of the supply chain to improve their interactions by sharing information and integrating the management of the planning process [11], all based on the individual data of each participating organization.
As shown in [12], different studies have stated that the CPFR model enhances the performance of the supply chain. An important example is provided by decision-making improvements resulting from the use of information technologies aimed at inter-organizational activities [13], [14], a strategy that also reduces the “whip effect” in the chain [15]. Another benefit comes from an increase in forecast accuracy, which reduces the size of inventories and increases their availability, thus leading to a better utilization of company assets and, hence, decreased system costs [16]. This model has been implemented in different business sectors such as foods [17], retail [18], pharmaceutics and agriculture [19], and transportation and logistics [20], among others.
According to [19], the hospital supplies industry is very likely to benefit from the CPFR model, which has been shown to help buyers and sellers of agricultural products minimize waste and reduce costs and risks. Hence, the model is likely applicable to pharmaceutical products since they are similar to agricultural ones with regards to their perishability.
CPFR in the Health Sector
Lin and Ho [21] applied a hierarchical process analysis to determine the pros and cons found in the implementation of CPFR models between suppliers and hospitals in Taiwan. They concluded that the main concern of the hospitals when it came to sharing their information in order to reduce costs was the lack of privacy. This implementation has been observed to depend on the varying medicine purchase practices of the hospitals. Panahirfar et al. [22] have established that most CPFR research corresponds to case studies, the differential characteristics of which are likely to bias the responses to the application of the model.
In view of the urgent need to generate shared value in the process of medicine dispensation to patients, this paper studies the case of the medicine distribution service for elderly people suffering arterial hypertension and diabetes in the city of Bogota (Colombia), framed in the operation of the national health system. Since the economic impact of this implementation has raised important concerns, it is necessary to provide a general description of this particular domain.
Dispensation of Medicines in Colombia
Generally speaking, the dispensation of medicines generates the greatest dissatisfaction among Colombian users [23]. The corresponding legal regulation [24] establishes that pending medication must be delivered to the patient’s home no later than 48 hours after request. However, non-compliance of this requirement by pharmacies reaches 4.6 % [23]. Furthermore, when the ordered medications are not part of the basic health benefits plan, 29 % of the patients receive their orders more than 20 days after their formulation [25]. This situation is likely to have catastrophic effects on patients suffering chronic diseases such as diabetes or hypertension, due to the implications of medical treatment discontinuity.
For the development of this research, a Colombian health insurance company belonging to the contributory section of the Social Security System was taken as reference. These organizations, which are locally known as Empresas Promotoras de Salud (EPS), are responsible for administering and ensuring the provision of health care services to their affiliated patients.
Within the analysis of the activities involved in the medicine dispensation process, such as demand planning and product distribution, it became clear that the EPS does not have enough information to carry out an adequate planning of the demand. According to the analysis presented by Ruiz [26] in 2014, this results from the lack of detailed information about both the medicines that are being ordered by the doctors and the number of users that are attending consultation and receiving medication. This situation not only determines low medicine dispensation service levels, but also certain loss of competitive advantage resulting from not being able to plan the demand or strategically articulate the information with the other actors of the system. In addition, a series of audits carried out by the EPS on the medicine dispensaries in 2017 revealed considerable failures in home deliveries and inadequate demand planning.
At the national level, chronic diseases account for most of the Colombian morbidity and mortality profile, as is also the case in the EPS studied in this research. Chronic diseases are, indeed, the fundamental precursors of other types of pathologies that affect vital organs [27]. Among chronic diseases, diabetes and arterial hypertension [5] stand out as precursors of ischemia and cerebrovascular diseases, which are the main causes of mortality among men and women over 60 years old [3], [4].
In addition, this population is under a mobility problem, not only due to their physical disabilities, but also for social reasons [28], [29]. Thus, it appears necessary to have an opportune pharmaceutical service that generates shared value for the members of the supply chain and helps the health system maintain these pathologies under control, thus avoiding high costs due to the lack of management and prevention of health risks.
Comparing CPFR to Other Models
There have been several comparisons between CPFR and other models [22]. In simulating the contrast between CPFR, VMI (Vendor Management Inventory), and the traditional model, Sari [30] found a better CPFR performance under market conditions of highly uncertain demand and long replenishment times. In comparing VMI and CPFR at different levels of correlation between the processes of demand, Aviv [31] found key differences in terms of production environments and the performance of the internal service.
These comparisons have also addressed the use of technologies and their effect on CPFR. In simulating the application of the RFID (Radio Frequency Identification) technology to VMI, CPFR, and the traditional SCM model, Sari [30] found better performance indicators in highly collaborative environments such as CPFR.
In turn, Ryu [32] has compared CPFR to consignment, VMI-i, and VMI-ii through their impacts on simulated supply chain performance. CPFR registered the best results when analyzing the entire chain, but only with regards to the purchaser. The overall results indicate that CPFR overcame only the traditional model, but not VMI-i, VMI-ii, or consignment.
Yuan, Shen, and Ashayeri [33] applied simulation techniques to compare CPFR, VMI, and JMI (Jointly Managed Inventory) in terms of their capability to manage the demand gap between high-tech industries. This allowed finding that CPFR performs similarly to JMI and better than others.
Although the aforementioned studies compared CPFR to other planning systems, the leading research question of this work compares CPFR to the current operation of a healthcare supply chain, from the perspective of decision making.
Decision Making Models for CPFR
In the process of implementing a collaborative model, facility location and product distribution constitute important planning decisions that have been addressed in the literature.
The facility location problem can be of two types, namely continuous (planar) or discrete [34]. Planar location applies to the lack of potential options to locate one or more facilities. Thus, the main decision has to do with defining the geographic coordinates for a single new facility, taking into account different objective functions such as the minimization of the weighed total distance or of the maximum distance, among others. Planar location is usually carried out through the median, gravity center, and Weiszfeld methods [35]. On the other hand, from the discrete point of view, a location is selected from a predefined set of alternatives (nodes). Discrete location is frequently carried out through heuristics such as ant colony, taboo search, and genetic algorithms [36].
Regarding product distribution, one of the most relevant and explored problems is the Vehicle Routing Problem (VRP), which seeks to define the routes of a vehicle fleet to meet the requirements of a set of customers. This problem is usually solved through both exact and heuristic methods [37]. Another important decision related to product distribution is the definition of the amounts to be sent to the different agents (suppliers, distribution centers, customers, etc.) of a supply network. This last problem is mainly linked to inventory lot sizing, which is typically addressed by models and methods for single or multiple products and echelons. Bushuev et al. [38] have made an interesting review of the state of the art in this regard, detailing the most common solution approaches for inventory lot sizing problems.
It is important to outline that the location, inventory, and routing problems can be addressed either sequentially or simultaneously. Typical combinatorial optimization problems that combine the mentioned logistics decisions (location, inventory, and routing) are the Inventory Routing Problem (IRP), the Location Routing problem (LRP), and the Location Inventory problem (LIP). After conducting surveys related to the IRP, LRP, and LIP, Roldán, Basagoiti, and Coelho [39], and Farahani et al. [40] report that they are often solved through exact models and heuristic and metaheuristic methods.
An additional input for making these decisions are demand forecast models. The most representative forecast quantitative models are moving average, weighted moving average, the Box-Jenkins/ARIMA method, and simple, double, and triple exponential smoothing, all of which are used according to the historical behavior of the demand [35].
In sum, the considerations made above raise two questions that are addressed in this paper:
How to design a supply chain of diabetes and arterial hypertension medicine based on CPFR, location, inventory, and routing approach? And how does this CPFR model compare to the operation of the current supply chain?
For this purpose, a CPFR model was designed for the supply chain in question, linking an EPS to a healthcare provider (known in the Colombian Social Security System as IPS-Institución Prestadora de Servicios). On these grounds, the comparison between the CPFR approach and the current operation was carried out using optimization models.
Metodología
Under the current operation, the EPS has contracted an IPS to make and execute all the logistics decisions relevant to the supply network. The proposed CPFR model, which modifies the current supply chain to minimize its operational costs, indeed requires the participation of the EPS in the decision-making process.
Current Supply Chain Model
Currently, the IPS has a single distribution center (DC) to store the medicines that are supplied by the laboratories. Thereafter, the medicines are distributed from the DC to a set of pharmacies of the IPS, each of which delivers them as required by a corresponding patient cluster, which is defined as a UPZs. Figure 1 depicts the current supply chain model.
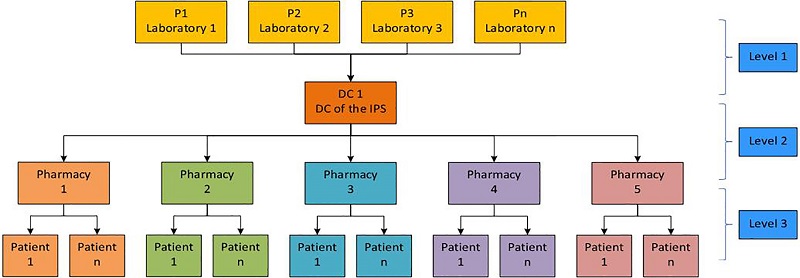 Figure 1.
Current supply chain
Source: Own elaboration
It is important to highlight that in the current decision-making process there is no formal approach to medicine demand estimation and inventory and routing decisions.
CPFR Model Design Methodology
The CPFR model design is based on a methodology by the Voluntary Interindustry Commerce Standards [41], with the participation of a logistics operator (actually an IPS) and the EPS that is responsible for administering and ensuring the provision of health services to a population group in the city of Bogota. In this particular case, the EPS wanted to evaluate the potential impact of assuming the responsibility of storing and distributing medicines to patients. Therefore, facility location and routing decisions were added to the standard CPFR methodology.
The mentioned CPFR model design methodology comprises four stages: Planning agreements, selection of medicines and demand planning, location of facilities, and medicine distribution through the supply network. The following tasks were executed in agreement with this methodology:
Agreements: The roles, rules, and responsibilities of both parties were established through collaboration agreements. This was done by applying weighted questionnaires to each of the participants in the modelling process. Key Performance Indicators (KPIs) were also defined in order to assess collaboration management, which was done through semi-structured interviews applied to the EPS and the IPS. Thus, a joint business plan was set by means of a SWOT (Strengths, Weaknesses, Opportunities, and Threats) matrix, which allowed defining the terms of participation and collaboration of each company in the CPFR model.
Selection of Medicines: Once the agreements had been established, the CPFR design took on the definition of the medicines whose dispensation would be jointly planned. For this purpose, a series of selection criteria (e.g., purchase and sales prices and product presentations) were applied to the clinical practice guidelines reported in the literature, the list of major medicine producers referred by these guidelines, and their costs within the supply chain. This allowed finally obtaining the list of medicines to be dispensed, which, in turn, facilitated subsequent comparisons.
Demand forecast: Subsequently, the demand forecast was carried out through the analysis of two data sources: (i) the 2016-2018 user database of the EPS with their general statistical data, and (ii) the accumulated cohort of hypertensive and diabetic patients. These data resulted in a consolidated list of users to be served within the proposed model. According to the behavior of the demand and the negative trend of the patient population of the EPS, demand forecasts were calculated using simple linear regression and the Holt method (also known as double exponential smoothing) for a six-month period [42], [43]. Taking into account the error assessment measurements, the most accurate method was established to estimate the behavior of the population and the monthly potential demand for each medicine per user.
Location of facilities: One of the main components of the collaboration agreements was to enhance the distribution process in the medicine supply network. Therefore, in the context of joint decision planning between the IPS and the EPS, the decision was made to evaluate the impact of establishing three new intermediate network Distribution Centers operated by the EPS (EPS DCs) for the current interaction with the IPS pharmacies. These three new DCs are intended to store the medicines sent by the IPS DC and distribute them to the patients. The goal is to enhance the supply chain in order to guarantee the availability of the medicines to the patients at the lowest cost. For this purpose, the number of EPS DCs was first optimized (i.e., balanced with the number of patients) through a factor rating matrix that facilitated the clustering of the patients around them. On these grounds, each of the three new DCs was finally located using the median method [35] and assuming rectilinear distances to separate the facilities. This method allows obtaining optimal geographical coordinates for each one of them, thus minimizing the distribution costs both from the IPS DC and to the potential patient clusters.
Medicines distribution cost minimization: The last step established in the CPFR-model-design collaboration agreements consisted in: (i) estimating the selected medicine amounts to be sent from the supplying laboratories to the IPS DC and from there to the three new EPS DCs; and (ii) defining the distribution routes from these new DCs to their corresponding patient clusters, as they had been assigned according to the identified costs.
For this purpose, the 3-level mathematical model proposed by Hamidi, Farahmand, and Sajjadi [44], which includes multiple products and origin nodes (i.e., warehouses or zero-level satellites) [45], was adapted according to the features of the problem at hand. The application of this model to the present problem is illustrated in figure 2, wherein Pi are first-order nodes (i.e., laboratories); DC1 is the IPS DC; RDi are the new intermediate distribution centers (EPS DCs); and Ci, the patients. The proposed mathematical model is detailed below:
Sets:
-
L: Set of laboratories
-
CD: Set of IPS distribution centers
-
RD: Set of EPS distribution centers
-
PR: Set of medicines types
-
Gr
: Set of patients assigned to EPS distribution center r
-
Tr
: Maximum number of nodes that can be visited to serve patients assigned to EPS distribution center r
Parameters:
-
TC: Travelling cost per km
SCm: Cost per km of direct shipment of one unit of medicine m
prodi,m
:Cost of purchasing one unit of medicine m in laboratory i
TD1l,c
: Traveling distance between laboratory l and IPS distribution center c
TD2c,r
: Traveling distance between IPS distribution center i and EPS distribution center j
TDr,i,j
: Travelling distance between points i and j assigned to EPS distribution center r
DFr,m
: Number of medicine units of type m required by EPS distribution center r
Variables:
-
U1l,c,m
: Number of medicine units of type m shipped from laboratory l to the IPS distribution center c
-
U2c,r,m
: Number of medicine units of type m shipped from the IPS distribution center c to the EPS distribution center r
-
Xr,i,j,t
: 1 if point i precedes point j and j is visited in the order t among the nodes that belong to the route of the distribution center r; 0 otherwise
Formulation of the model:
Subject to:
This model aims to minimize the total distribution costs of the supply network (1). Constraints (2) ensure that patients are visited only once and in a specific order for each distribution route of each EPS distribution center. Constraints (3) imply that every point that is entered into by a vehicle should be left by the same vehicle. Constraints (4) force the connection between visited patients and their corresponding EPS distribution center. Constraints (5) and (6) relate the medicine amounts shipped from the laboratories and IPS DCs in order to satisfy the aggregated demand of the EPS DCs. Constraint sets (7) define the routing decision variables as binary. Finally, constraints (8) and (9), states that the related decision variables should be no negative.
As it can be seen, the proposed model only considers routing decisions from each EPS DC to its assigned cluster of patients. In the other levels, direct distribution is assumed between the laboratories and the IPS DC, and between the latter and each of the three EPS DCs. It is important to notice that this model considers as inputs: (i) the estimation of the medicine required by each EPS distribution center; (ii) the distribution costs, (iii) the distances between laboratories and the IPS DC; (iv) the distances between the IPS DC and the three new EPS DCs; and (v) a distance matrix related to the interaction between each EPS DC an its assigned cluster of patients (UPZs). It is important to notice that capacity constraints were not taken into account since, given the features of the products, it can be assumed that a vehicle is capable of visiting all the patient clusters assigned to each EPS distribution center in a single trip.
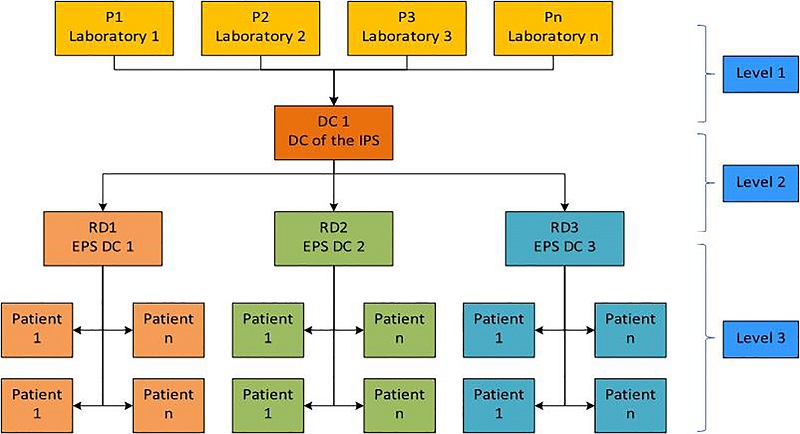 Figure 2.
CPFR supply chain model
Source: Own elaboration
The current optimization model is characterized by shared decision making between the EPS and the IPS. It is important to highlight that it was applied after defining the location of the three new intermediate distribution centers (EPS DCs or RDs). The clusters of patients (UPZs) served by each RD were predefined according to the concentration of demand in three areas of the city (south, southwest, and north).
Current and Proposed Supply Chain Decision Processes
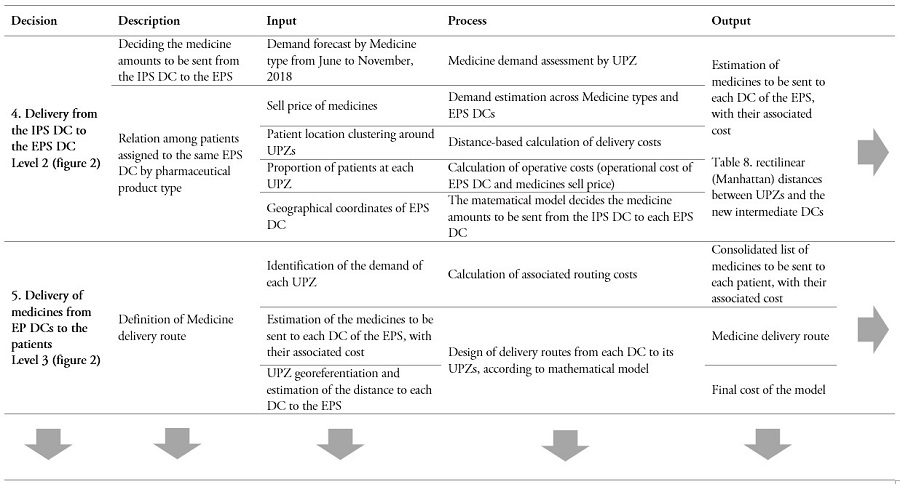
The decision-making processes of the current supply chain and the proposed supply chain are shown in tables 1 and 2. These tables synthesize each decision process and its required inputs and outputs. It is important to outline that for comparison purposes, the forecasts obtained by means of the proposed CPFR were considered as an input for evaluating the impact of the current and the proposed supply chain models.
Table 1.
Decision process in the current supply chain
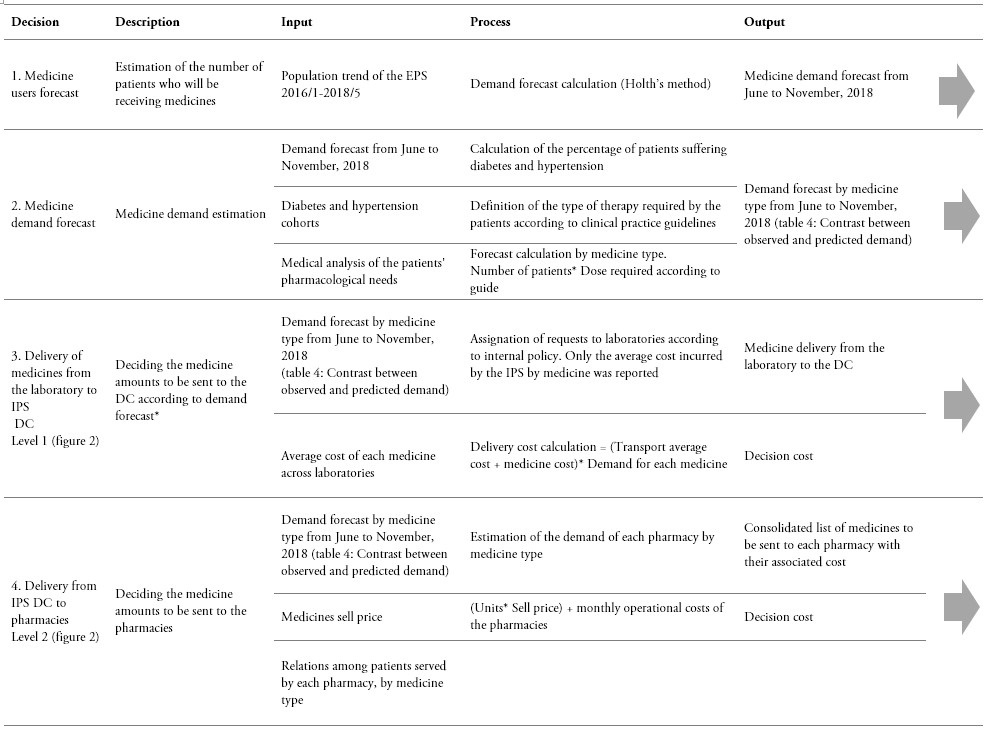
* Due to information restrictions, no individual laboratory data are available. Instead, the only available data correspond to request from the IPS to the laboratories.
** The table can be read horizontally to understand the incoming information, processing, and outcome for each decision. Yet, the table can also be read vertically, in order to observe the sequence of steps involved in each element of the decision model.
Source: Own elaboration
Table 1.
Decision process in the current supply chain (Cont...)

* Due to information restrictions, no individual laboratory data are available. Instead, the only available data correspond to request from the IPS to the laboratories.
** The table can be read horizontally to understand the incoming information, processing, and outcome for each decision. Yet, the table can also be read vertically, in order to observe the sequence of steps involved in each element of the decision model.
Source: Own elaboration
Table 2.
Decision process in the CPFR supply chain
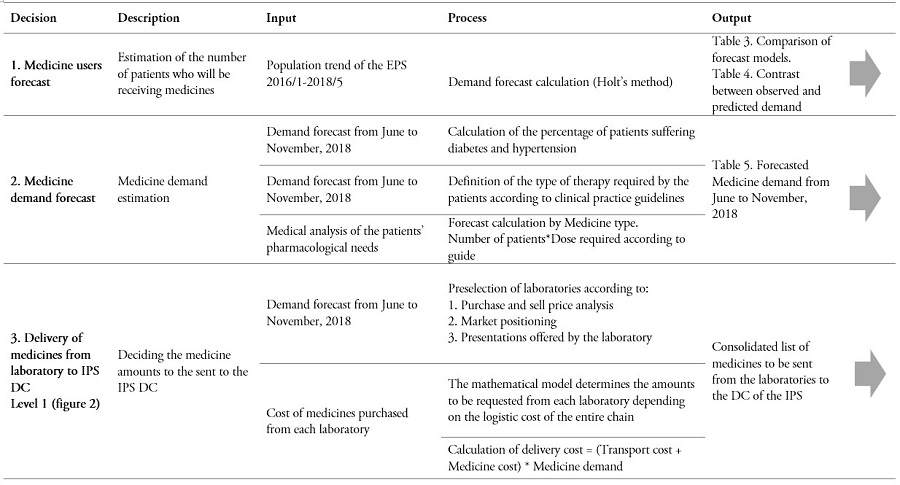
* Due to information restrictions, no individual laboratory data are available. Instead, the only available data correspond to request from the IPS to the laboratories.
** The table can be read horizontally to understand the incoming information, processing, and outcome for each decision. Yet, the table can also be read vertically, in order to observe the sequence of steps involved in each element of the decision model.
Source: Own elaboration
Table 2.
Decision process in the CPFR supply chain (Cont...)
* Due to information restrictions, no individual laboratory data are available. Instead, the only available data correspond to request from the IPS to the laboratories.
** The table can be read horizontally to understand the incoming information, processing, and outcome for each decision. Yet, the table can also be read vertically, in order to observe the sequence of steps involved in each element of the decision model.
Source: Own elaboration
Results
Current and CPFR Supply Chain Models
The methodology outlined above allowed for the definition of the desired CPFR model and the comparison of its decision model to that of the current operation. The results of the decisions required in tables 1 and 2 are detailed below.
Inputs of the Optimization Models
The comparison of the models was carried out by optimizing the inputs of their corresponding supply chains at each decision level, as shown below:
Demand Forecast
Users
Based on the historical demand data of the previous 29 months, figure 3 shows a negative trend. Hence, the Holt-Winters and linear regression models were used to forecast the demand.
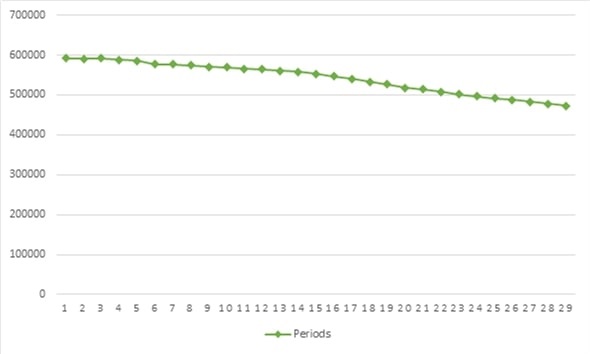 Figure 3.
Medicine demand historical record
Source: Own elaboration
Since the Holt method exhibited better results regarding three out of four performance measures, it was selected to forecast the demand (table 3).
Table 3.
Comparison of the forecast models
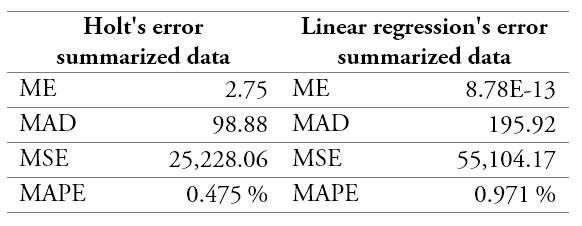
ME: Mean Error; MAD: Mean Absolute Deviation; MSE: Mean Standard Error; MAPE: Mean Absolute Percentage Error.
Source: Own elaboration
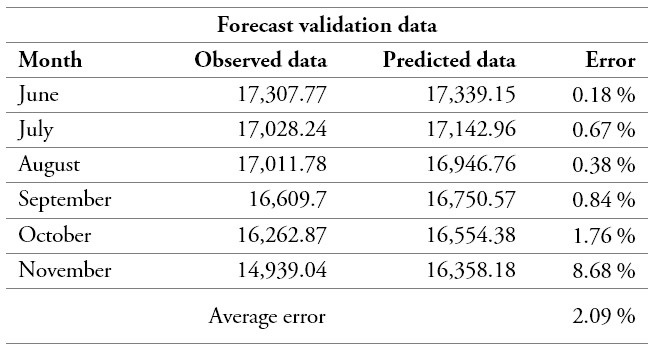
Later on, and in order to validate the accuracy of the selected model for a longer planning horizon, the medicine demand was estimated over a six-month period. The resulting information was compared to the actual data of the EPS as adjusted according to statistical estimates of the modelled population. This contrast indicated a total average error of 2.09 %, which represents a good performance since it stands below the 10 % recommended threshold [46] (table 4).
Table 4.
Contrast between observed and predicted demand
Source: Own elaboration
In turn, figure 4 illustrates the behavior of the error in the two studied models.
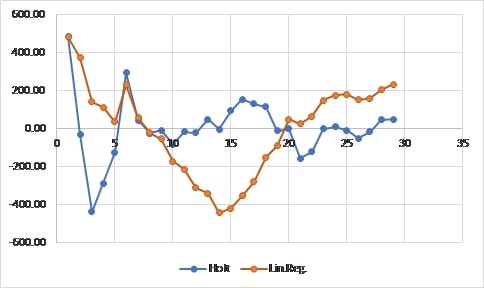 Figure 4.
Error forecast
Source: Own elaboration
Medicine Demand Forecast
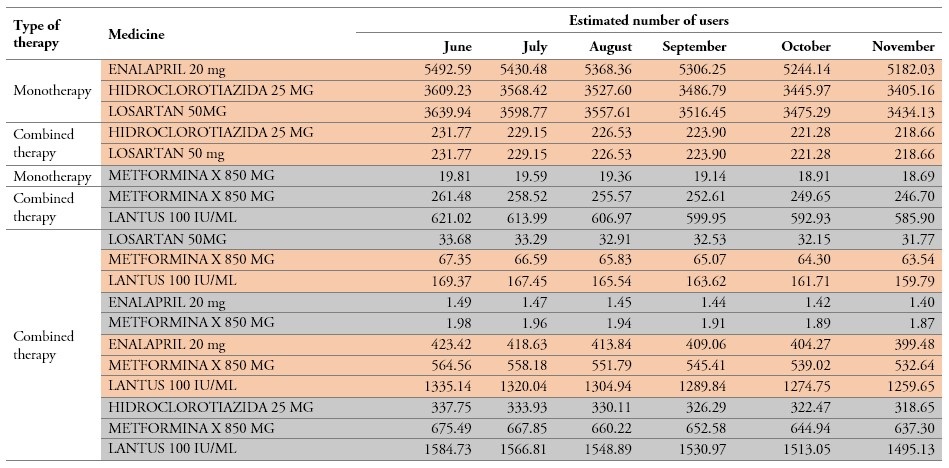
Another necessary input to predict the demand has to do with the medicines that the users require according to their pathologies. For this purpose, the literature on the most cost-effective medicines for the treatment of diabetes and arterial hypertension was reviewed. Then, data of the cohort of patients served by May of 2018 were taken as a reference to decide on the patients’ prescription. Glycosylated hemoglobin values were used to select the medicines and type of therapy for the treatment of diabetes, namely monotherapy (single medicine prescription) or combined therapy (prescription of several medicines). Blood pressure values were used to assign the treatment of arterial hypertension, and a combination of both variables was used to define the treatment of arterial hypertension + diabetes. It is important to bear in mind that, at the time of diagnosing diabetes, monotherapy is assigned as initial treatment with the use of metformin. In case the treatment does not show positive results for a period of 4-6 months, it is necessary to change the treatment to combined therapy, including metformin and insulin, with a 3-6-month follow-up. Table 5 presents the resulting forecast for each medicine.
Table 5.
Forecasted medicine demand from June to November 2018 (Summarized data)
Source: Own elaboration
Locating the Intermediate DCs (RDs)
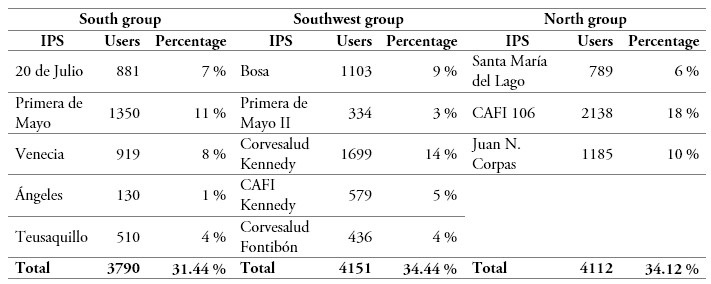
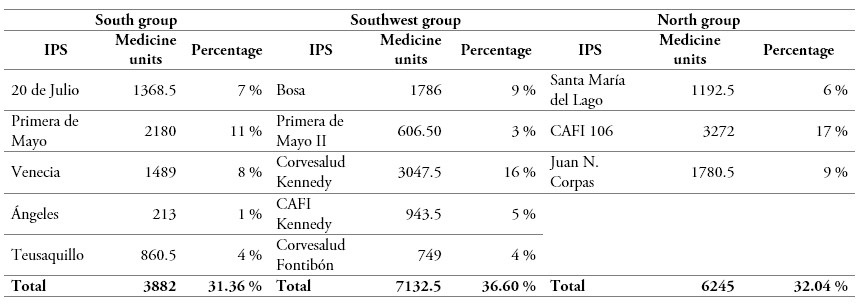
The estimation of the number of new EPS DCs (RDi) was based on the balance between two criteria, namely number of users and number of medicine units assigned to each of them. According to the information provided by the IPS, the concentration of the demand can be carried out in three areas of the city (south, southwest, and north). Thus, and taking the primary healthcare centers of the IPS currently serving the population as their primary clustering nodes, table 6 shows the relation between IPS primary healthcare centers, population, and proposed DCs for the data of a single month. Table 7 shows the relation between IPS primary healthcare centers, medicine demand, and proposed DCs for the same period.
Table 6.
Relation between geographic location and population assigned to first level medical centers of the IPS
Source: Own elaboration
Table 7.
Relation between geographic location of the first level medical centers of the IPS and monthly medicines demand
Source: Own elaboration
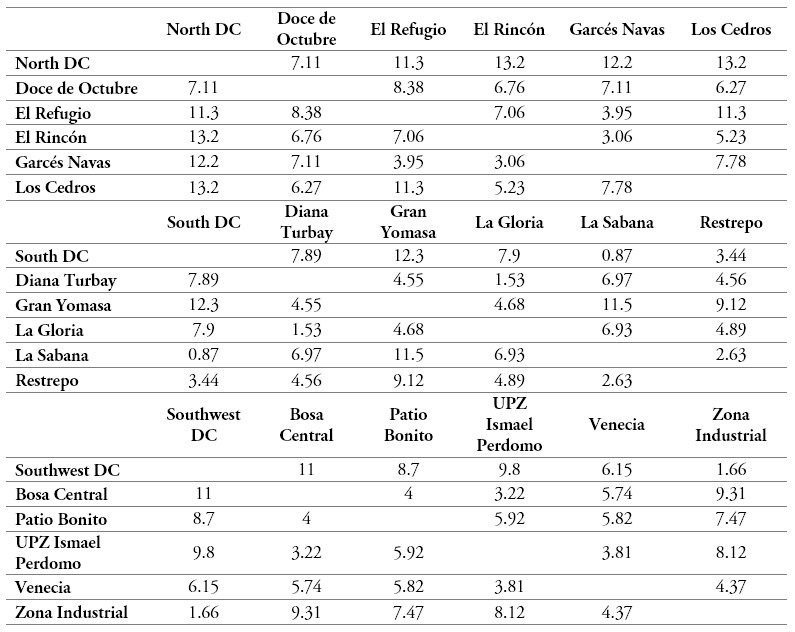
Subsequently, the location of the new intermediate EPS DCs was defined by means of the median method [35]. The assignation of a specific population fraction to each intermediate DC was based on the demographic data of the Zone Planning Units (Unidades de Planeación Zonal-UPZ) of Bogota. Thus, the main neighborhoods of each unit were assigned a number of patients proportional to the population weight of each UPZ within the total population of the city. Table 8 shows the matrices of the rectilinear (Manhattan) distances between the UPZs and the proposed DCs.
Table 8.
Rectilinear (Manhattan) distances between UPZs and the new intermediate DCs
Source: Own elaboration
Comparison between Models
The aforementioned inputs allowed developing the CPFR and current operation models. Subsequently, and having as objective function the total supply chain cost minimization, Hamidi’s optimization model (wherein DC location was relaxed), allowed establishing: (i) which laboratories dispense the medicines, (ii) which medicines they provide, and (iii) their medicine dispensation routes to the users. Tables 9 and 10 show the cost comparison between the two studied models across their operational levels for September and November of 2018. This comparison considers the distribution of five products, for which the current supply network is composed by seven laboratories, one IPS DC, five pharmacies, and 15 patients (figure 2). In turn, the proposed network replaces the existing pharmacies with a system of medicine distribution to patients from three new intermediate distribution centers (EPS DCs) (figure 1).
Total Cost Comparison
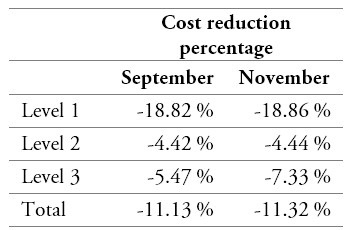
Table 9 shows the projected results for September and November of 2018 after modifying the current operation model according to the CPFR approach, which certainly lowers the costs.
Table 9.
Cost comparison between CPFR and the current operation model

* Includes the cost of new intermediate DCs.
** Includes the current pharmacy operation costs.
Source: Own elaboration
Partial Cost Comparison
Table 10 shows the cost comparison disaggregated for each level, considering the decision-making process of the current operation and the proposed CPFR approach described in table 1.
Table 11 shows that CPFR decisions and organizational strategies bring about significant cost reductions, despite the costs of adding three DCs. These reductions arise from the CPFR agreements between links and from the methods employed to locate the intermediate DCs and generate the medicine distribution routes.
Table 10.
Cost comparison across levels of the current operation and the proposed CPFR approach

Source: Own elaboration
Table 11.
Cost reduction percentages across levels of the current operation and the proposed CPFR approach
Source: Own elaboration
Service Level Comparison
In the current operation, the satisfaction of the customer is a function of the immediate delivery of the medicines to the patients, whose number can be observed to decrease during the studied period. By comparing these results to those of the CPFR model, which aims to cover the entire population, its impact on customer satisfaction can be easily observed.
Table 12.
Service level comparison

Source: Own elaboration
Discussion and Conclusions
The results of this work highlight the relevance of the CPFR model here developed to plan the medicine supply to the users of the Colombian health system. The model guarantees timely delivery to the patients through methods aimed at optimizing logistics costs.
The historical records of timely delivery of medicines to patients during the second semester of 2018 show percentages of 98 %, 88 %, and 68 %, corresponding to three sequential two-month periods. These variations are partly related to the difficulties implied in estimating demand behavior. Contrarily, a 100 % satisfaction could have been guaranteed without resorting to any safety stock if delivery had been planned on the basis of the CPFR medicine demand forecast. It is important to clarify that these forecasts were slightly above the real demand by 0.15 %, 1.38 % and 9.5 % for each two-month period, respectively.
On the other hand, by comparing the logistics costs of the current operation to those of the proposed model, it becomes clear that the latter would allow monthly average savings of around COP $40,000,000. These savings are distributed among the three levels of the supply chain, which, in ascending order, could be sparing their corresponding expenses by 77 %, 18 %, and 5 % of said amount. The main reduction, which occurs at the first level (19 % with respect to the current operation), is partly due to the CPFR agreements and their consequent reduction of the prices at which the IPS purchases the medicines from the laboratories. Likewise, the relocation of the IPS’s DC reduces the costs of distributing the medicines from the laboratories. The savings generated at level 2 (4 % with respect to the current operation) are mainly due to the implementation of three intermediate DCs strategically located to minimize the distribution costs from the IPS DC. Finally, a 6 % cost reduction is generated at level 3, corresponding to the optimization of the distribution routes to the patients, obtained by the aforementioned mathematical model.
In sum, the current results show the advantages of an integral planning of the interaction between the three links of the studied supply chain through the CPFR model, supported by the use of quantitative methods for demand forecast, location of facilities, and vehicle routing. As it can be verified, said results respond to the questions raised in this paper. It is worth noting that, insofar as a collaborative planning can be guaranteed throughout the chain, it is possible to have greater control in the decision-making process, which, in turn, allows reducing costs and attaining satisfactory service levels.
Nevertheless, it is important to consider that the solution proposed in this work could be reinforced through future research by considering additional optimization methods aimed at improving logistics costs under the CPFR approach. Just as well, other collaborative approaches such as VMI can be considered and evaluated. Also, demand simulations can be carried out to evaluate the behavior of collaborative interventions on costs and service levels, taking into account demand variability.
References
[1] “Eurostat Mortality Statistics,” 2012. [Online]. Available: https://appsso.eurostat.ec.europa.eu/nui/show.do?dataset=hlth_cd_aperrto&lang=en
[2] Organización Mundial de la Salud (OMS), “Temas de salud: hipertensión,” Oct. 2015. [Online]. Available: http://www.who.int/topics/hypertension/es/. Accessed on: July 15, 2018.
[3] C. Muñoz, “Enfermedad cerebrovascular,” acn.web, 2011. Available: http://www.acnweb.org/guia/g1c12i.pdf
[4] Instituto Mexicano del Seguro Social (IMSS), Diagnósticoy Tratamiento de la Cardiopatía Isquémica Crónica. Ciudad de México: IMSS, 2019. Available: http://www.imss.gob.mx/sites/all/statics/guiasclinicas/000GERCardiopatiaIsquemica.pdf
[5] K. Gallardo, F. Benavides, and R. Rosales, “Costo de la enfermedad crónica no transmisible: la realidad colombiana,” Rev. Cienc. Salud, vol. 14, no. 1, pp. 103–114, 2016. doi: dx.doi.org/10.12804/revsalud14.01.2016.09
[6] W. Stevenson, Operations Management. New York: McGraw-Hill, 2002.
[7] M. Cao, M. Vonderembse, Q. Zhang, and T. S. Ragu-Nathan, “Supply chain collaboration: Conceptualization and instrument development,” Int. J. Prod. Res., vol. 48, no. 22, pp. 6613–6635, 2010. DOI: 10.1080/00207540903349039
[8] J. L. Calderón and F. Lario, “Análisis del modelo SCOR para la gestión de la cadena de suministro,” presented at IX Congr. Ing. Organiz., Gijón, September 8-9, 2005, pp. 1–10. Available: http://www.adingor.es/Documentacion/CIO/cio2005/items/ponencias/41.pdf
[9] J. Rohde, H. Meyr, and M. Wagner, “Die supply chain planning matrix,” PPS Manage., vol. 5, no. 1, pp. 10–15, 2000.
[10] J. Cooke, “VMI: Very mixed impact?,” Logist. Manage. Distrib. R., vol. 37, no. 12, pp. 51–54, 1998.
[11] I. Ribas and R. Companys, “Estado del arte de la planificación colaboritiva en la cadena de suministro: contexto determinista e incierto,” Intangible Capital, vol. 3, no. 3, pp. 91–121, 2017. Available: https://www.intangiblecapital.org/index.php/ic/article/view/30/59
[12] C. A. Hill, G. P. Zhang, and K. E. Miller, “Collaborative planning, forecasting, and replenishment & firm performance: An empirical evaluation,” Int. Sharing Coordination Make-to-Order Supply Chains, vol. 23, no. 6, pp. 579–598, 2005.
[13] N. Sanders, “An empirical study of the impact of e-business technologies on organizational collaboration and performance,” J. Oper. Manage., vol. 25, no. 6, pp. 1332–1347, 2007. Available: https://doi.org/10.1016/j.jom.2007.01.008
[14] F. Sahin and E. Robinson, “Information sharing and coordination in make-to-order supply chain,” J. Oper. Manage., vol. 23, no. 6, pp. 579–598, 2005. Available: https://doi.org/10.1016/j.jom.2004.08.007
[15] H. Lee, V. Padmanabhan, and S. Whang, “The bullwhip effect in supply chains,” Sloan Manage. Rev., vol. 38, no. 1, pp. 93–102, 1997. Available: https://sloanreview.mit.edu/wp-content/uploads/1997/04/633ecdb037.pdf
[16] Q. Gu, T. Jitpaipoon, and J. Yang, “The impact of information integration on financial performance: A knowledge-based view,” Int. J. Prod. Econ., vol. 191, no. 1, pp. 221–232, 2017. Available: https://doi.org/10.1016/j.ijpe.2017.06.005
[17] G. Fliedner, “CPFR: An emerging supply chain tool,” Ind. Manage. Data Syst., vol. 103, no. 1, pp. 14–21, 2003. doi: 10.1108/02635570310456850
[18] T. Chang, H. Pu, W. Lee, and Y. Lin, “A study of an augmented CPFR model for the 3C retail industry,” Supply Chain Manag. Int. J., vol. 12, no. 3, pp. 200–209, 2007. doi: 10.1108/13598540710742518
[19] X. Du, S. Leung, J. Zhang, and K. Lai, “Procurement of agricultural products using the CPFR approach,” Supply Chain Manage. Int. J., vol. 14, no. 4, pp. 253–258, 2009. Available: https://doi.org/10.1108/13598540910970081
[20] J. Karolefsky, “Collaborating across the supply chain,” Food Logist. Retailtech, vol. 3, no. 1, pp. 24–34, 2001.
[21] R. Lin and P. Ho, “The study of CPFR implementation model in medical SCM of Taiwan,” Prod. Plann. Control, vol. 25, no. 3, pp. 260–271, 2014. doi: 10.1080/09537287.2012.673646
[22] F. Panahifar, C. Heavey, P. J. Byrne, and H. Fazlollahtabar, “A framework for collaborative planning, forecasting and replenishment (CPFR) state of the art,” J. Enterprise Inf. Manage., vol. 28, no. 6, pp. 838–871, 2015. doi: 10.1108/JEIM-09-2014-0092
[23] Ministerio de Salud y Protección Social, “Encuesta de evaluación de los servicios de la EPS 2017,” Ministerio de Salud y Protección Social, 2017. Available: https://www.minsalud.gov.co/sites/rid/Lists/BibliotecaDigital/RIDE/DE/CA/Informe-encuesta-satisfaccion-eps-2017.pdf
[25] Ministerio de Salud y Protección Social, May 17, 2013, “Resolución 1604 de 2013, por la cual se reglamenta el artículo 131 del Decreto Ley 019 de 2012 y se dictan otras disposiciones”. Available: https://www.minsalud.gov.co/sites/rid/Lists/BibliotecaDigital/RIDE/DE/DIJ/resolucion-1604-de-2013.pdf
[25] Consultor Salud, “Resultados encuestas mipres-medicamentos no pos no están siendo entregados,” 2017 [Online]. Available: https://consultorsalud.com/resultados-encuesta-mipres-medicamentos-no-pos-no-estan-siendo-entregados/
A. Ruiz, “Factores claves en la planeación de demanda en el sector farmacéutico,” 2014 [Online]. Available: https://repository.unimilitar.edu.co/bitstream/handle/10654/11584/ANDREA%20MILENA%20RUIZ%20RUIZ.pdf;jsessionid=A203263E9B567BBBB9BDC1F3C97E838F?sequence=1. Accessed on: Jun. 6, 2019
[27] Organización Panamericana de la Salud and Ministerio de Salud y Protección Social, “Resúmenes de política: intervenciones poblacionales en factores de riesgo de enfermedades cronicas no transmisibles,” Ministerio de Salud y Protección Social, 2015. Available: https://www.minsalud.gov.co/sites/rid/Lists/BibliotecaDigital/RIDE/VS/PP/ENT/intervenciones-poblacionales-factores-riesgo-enfermedades-no-transmisibles.PDF
[28] Ministerio de Salud y Protección Social, “SABE Colombia 2015: Estudio Nacional de Salud, Bienestar y Envejecimiento,” Ministerio de Salud y Protección Social, 2016. Available: https://www.minsalud.gov.co/sites/rid/Lists/BibliotecaDigital/RIDE/VS/ED/GCFI/Resumen-Ejecutivo-Encuesta-SABE.pdf
[29] Ministerio de Salud y Protección Social, “Diagnóstico preliminar sobre personas mayores, dependencia y servicios sociales en Colombia,” Ministerio de Salud y Protección Social, 2017. Available: https://www.minsalud.gov.co/proteccionsocial/Documents/Situacion%20Actual%20de%20las%20Personas%20adultas%20mayores.pdf
[30] K. Sari, “Exploring the impacts of radio frecuency identification (RFID) technology on supply chain performance,” Eur. J. Oper. Res., vol. 207, no. 1, pp. 174–183, 2010. doi: 10.1016/j.ejor.2010.04.003
[31] Y. Aviv, “Gaining benefits from joint forecasting and replenishment processes: The case of auto-correlated demand,” Manuf. Serv. Oper. Manage., vol. 4, no. 1, pp. 55–74, 2002. doi: 10.1287/msom.4.1.55.285
[32] C. Ryu, “An investigation of impacts of advanced coordination mechanisms on supply chain performance: consignment, VMI I, VMI II, and CPFR,” Ph.D. dissertation, State University of New York at Buffalo, 2006. http://hdl.handle.net/10477/49189
[33] X. Yuan, L. Shen, and J. Ashayeri, “Dynamic simulation assessment of collaboration strategies to mange demand gap in high-tech product diffusion,” Robot. Comput.-Int. Manuf., vol. 26, no. 6, pp. 647–657, 2010. Available: https://doi.org/10.1016/j.rcim.2010.06.020
[34] C. ReVelle and H. Eiselt, “Location analysis: A synthesis and survey,” Eur. J. Oper. Res., vol. 165, no. 1, pp. 1–19, 2015. Available: https://doi.org/10.1016/j.ejor.2003.11.032
[35] S. Nahmias and T. Olsen, Production and Operations Analysis, 7th Ed. Chicago: Waveland Press, 2015.
[36] S. Basu, M. Sharma, and P. S. Ghosh, “Metaheuristic applications on discrete facility location problems: A survey,” Opsearch, vol. 52, no. 3, pp. 530–561, 2015. doi: 10.1007/s12597-014-0190-5
[37] S. N. Kumar and R. Panneerselvam, “A survey on the vehicle routing problem and its variants,” Intell. Inf. Manage., vol. 4, no. 1, pp. 66–74, 2012. doi: 10.4236/iim.2012.43010
[38] M. Bushuev, A. Guiffrida, M. Jaber, and M. Khan, “A review of inventory lotsizing review papers,” Manage. Res. Rev., vol. 38, no. 3, pp. 283–298, 2015. doi: 10.1108/MRR-09-2013-0204
[39] R. Roldán, R. Basagoiti, and L. Coelho, “A survey on the inventory-routing problem with stochastic lead times and demands,” Comput. Oper. Res., vol. 24, pp. 15–24, 2017. Available: https://doi.org/10.1016/j.jal.2016.11.010
[40] R. Farahani, H. Rashidi-Bajgan, B. Fahimnia, and M. Kaviani, “Location-inventory problem in supply chains: A modelling review,” Int. J. Prod. Res., vol. 53, no. 12, p. 3769–3788, 2015. Available: https://doi.org/10.1080/00207543.2014.988889
[41] Voluntary Interindustry Commerce Standards, Collaborative planning, and replenishment (CPFR): An overview. Lawrenceville: VICS, 2004. Available: https://www.gs1us.org/DesktopModules/Bring2mind/DMX/Download.aspx?Command=Core_Download&EntryId=492
[42] R. Ballou, Logistica: administración de la cadena de suministro. Ciudad de México: Prentice Hall, 2004.
[43] J. Hanke and D. Wichern, Pronósticos en los negocios. Ciudad de México: Pearson Education, 2005.
[44] M. Hamidi, K. Farahmand, and R. Sajjadi, “Modeling a four-layer location-routing problem,” Int. J. Ind. Eng. Comput., vol. 3, no. 1, pp. 43–52, 2012. doi: 10.5267/j.ijiec.2011.08.015
[45] J. Gonzalez-Feliu, “The N-echelon location routing problem: concepts and methods for tactical and operational planning,” Int. T. Oper. Res., vol. 1, no. 1, pp. 1–11, 2009. Available: https://pdfs.semanticscholar.org/4fe0/588e3800e989900e353dd7fc9e6676a2a683.pdf?_ga=2.201196526.1528262281.1592860987-707412495.1592328274
[46] S. Kim and K. Heeyoung, “A new metric of absolute percentage error for intermittent demand,” Int. J. Forecast., vol. 32, no. 3, pp. 669–679, 2016. Available: https://doi.org/10.1016/j.ijforecast.2015.12.003
Notes
*
Research article
Author notes
a Corresponding author. E-mail: mpcaro@javeriana.edu.co
Additional information
How to cite this article: F. A. Chuchoque-Urbina, M. P. Caro-Gutierrez, and C. E. Montoya, “Design of a CPFR, location, inventory and routing approach to diabetes and high blood pressure medicine supply network planning,” Ing. Univ., vol. 25, 2021 [Online]. https://doi.org/10.11144/Javeriana.iued25.dcli


 (1)
(1) (2)
(2) (3)
(3) (4)
(4) (5)
(5) (6)
(6) (7)
(7) (8)
(8) (9)
(9)


