


APA
ISO 690-2
Harvard
Haga clic en un formato de citación
Resources Allocation in Service Planning Using Discrete-Event Simulation*
Asignación de recursos en la planeación de servicios empleando simulación de eventos discretos
Ingeniería y Universidad, vol. 25, 2021
Pontificia Universidad Javeriana
Mauricio Becerra-Fernandez a mbecerra@ucatolica.edu.co
Universidad Católica de Colombia, Colombia
Milton M. Herrera
Universidad Militar Nueva Granada, Colombia
Cristian Trejos
Emlyon Business School, Francia
Olga R. Romero
DHL, Colombia
Received: 27 February 2019
Accepted: 03 July 2020
Published: 17 June 2021
Abstract: Objective: Calculate the required personnel and resources needed to fulfill the service promise agreed with the customer. Methods and materials: This paper presents a discrete event simulation (DES) model developed to select and implement a Point of Sale (POS) for a company providing financial products. First, the paper shows the characterization of the system components and times per process. Then, hypothesis testing and goodness-of-fit statistics are estimated. Subsequently, the simulation scenarios assess the times between arrivals and the number of commercial advisers. Results and discussion: This model allows us to assess the allocation of resources to fulfill the service promise, which is that 80 % of customers must be served within one hour or less. This paper provided the service isoquants allowing us to observe the behavior of the performance metrics (service promise fulfillment) among different scenarios. Conclusions: The use of DES techniques allows for the evaluation of the assignment of personnel to achieve the fulfillment of the service promise, including facilities, equipment, and the evaluation of related processes. These methods can be extended to the analysis of resource allocation in the development of other processes, observing the relationship between service quality and operating costs.
Keywords:Discrete event simulation, isoquants, resource allocation, service planning, waiting lines.
Resumen: Objetivo: realizar el cálculo del personal requerido y los recursos necesarios para alcanzar el cumplimiento de la promesa de servicio pactada con el cliente. Materiales y métodos: este artículo presenta un modelo de simulación de eventos discretos (DES, por sus siglas en inglés), desarrollado para la implementación un punto de venta (POS) para una empresa que provee productos financieros. En la primera parte, el artículo muestra la caracterización de los componentes del sistema y los tiempos de proceso, seguido de la estimación estadística de las pruebas de hipótesis y de bondad de ajuste. Posteriormente, los escenarios de simulación evalúan los tiempos entre las llegadas y el número de asesores comerciales. Resultados y discusión: este modelo permite evaluar la asignación de recursos para cumplir la promesa de servicio, la cual es que el 80 % de los clientes deben ser atendidos en una hora o antes. Este artículo proporciona las gráficas isocuantas de servicio que permiten observar el comportamiento de la medida de desempeño (cumplimiento de la promesa de servicio) entre los diferentes escenarios. Conclusiones: Usando técnicas de DES es posible evaluar la asignación de personal para lograr el cumplimiento de la promesa de servicio, considerando las instalaciones, herramientas y evaluación de los procesos relacionados. Estos métodos se pueden extender al análisis de asignación de recursos en el desarrollo de otros procesos, observando la relación entre la calidad del servicio y los costos de operación.
Palabras clave: simulación de eventos discretos, isocuantas, planeación de servicios, asignación de recursos, líneas de espera.
Introduction
In some cases, service systems are supported by planning models that comprise resource allocation [1, 2, 3, 4]. These models seek to optimize the available service capacity to meet the customer’s requirements. Despite the solutions obtained by service planning models considering resource capacity, these rarely contemplate performance measures to evaluate compliance of service levels [3]. Additionally, the solution obtained by service and supply planning models is static [5], [6] and seldom based on dynamic simulation scenarios [1], [7]. Given that service systems must have sufficient capacity to guarantee service levels, this paper developed a discrete event simulation (DES) model that analyzes the required resources over a finite horizon.
The health sector has been using DES as an effective tool for allocating scarce resources to improve patient flow, while minimizing healthcare delivery costs and increasing patient satisfaction [8, 9, 10]. Previous studies have examined the resource allocation problems to optimally manage the arrival demands for different service sectors [11, 12, 13], occasionally for financial services. Given that financial services have a closer relationship with retail, the alliance between a financial institution and a retailer consists of the allocation of a Point of Sale (POS) for credit cards that share the brand of both the retailer and the financial institution. Through this card, customers can access the products of the retailer by performing fast and straightforward transactions. In this context, this paper evaluates the performance of financial institutions and retailers through service levels promised.
The case study assessed in this paper considers two assumptions. First, allocating a new POS for a financial institution requires special attention because it must guarantee the fulfillment of the service promise. For this case study, the service promise states that 80 % of clients should not wait more than one hour in the process of applying for a credit card, starting from the time they arrive to apply for the credit card until they find out whether their application was approved or rejected. Second, another constraint for allocating the POS is not presenting high rates of underutilization of the resources invested, including data collection and analysis equipment, multifunction printers, card printers, telephones, and facilities such as advisory modules.
In this context, this paper shows a DES model for the allocation of a POS, fulfilling the necessary conditions to achieve the established service promise and effective resource use. To do this, we obtained the metrics of the time required to process the credit card application. These metrics served as input for the development of the model within the ProModel software and to test scenarios by varying the number of commercial advisers assigned to evaluate the fulfillment of the service promise.
This paper on resource allocation differs from other research because it sought to find a balance between service promise and effective use of resources. Consequently, our model aims to fulfill the service promise, whereas previous models track only the behavior of vendors and customers [14]. Also, this research is related to earlier studies on resource allocation problems, which have gained attention in operations research [3].
The rest of the paper is organized as follows: A brief review of the literature is presented in the second section. This section highlights some studies that examined the resource allocation problem and service planning. Then, in the third section, this paper describes the methodology used. The results of the simulation model are presented in the fourth section. In the last part of this paper the conclusions and future research are presented.
Literature Review
Although there is a wide range of applications using DES, ranging from manufacturing to service provision, few studies present an analysis of resource capacity that includes service levels. For instance, there are numerous simulation studies in literature attempting to understand the relationship that may exist between various inputs into a system (e.g., patient scheduling and staff resources) and different output performance measures from the system (e.g., patient waiting times) [8], [11]. However, they rarely combine service levels and resource capacity applied to financial services [7].
The application of DES and its ability to model the various scenarios for dynamic decision making in the manufacturing sector have been extensively discussed [15, 16, 17]. These studies developed simulation models for a subset of manufacturing activities that facilitate “what-if” scenario planning for a proposed process alternative. The usefulness of DES models lies on the search for significant improvement over current processes in terms of throughput time reduction, better resource utilization, operating cost reduction, and reduced bottlenecks. Despite DES models illustrating a methodology appropriate to improve manufacturing processes, the performance measure “fulfillment of the service promise” is not frequently utilized.
While the outcome of a simulation study improves sequencing activities and planning processes, there is a disruption between capacity planning and service levels that needs to be further considered. To solve this issue, the different simulation approaches such as system dynamics and DES have reported successful alternatives [1], [18, 19, 20]. In this way, a framework for developing DES models for resource-intensive service businesses was provided by some authors [21]. These models simulate planning of service engagements, supply planning of human resources, attrition of resources, termination of resources, and execution of service orders to estimate the business performance of resource-intensive service businesses. It allows estimating the serviceability, costs, revenue, profit, and quality of service businesses. Thus, DES models are useful for evaluating the effectiveness of resource management policies [22].
The resource allocation for scheduling and sequencing activities also has been extensively considered [23]. Activities are combined based on the available resource quantities, and all combinations are evaluated through a DES model taking into account the constraints of resource quantities. The simulation model developed provided an alternative way to produce optimal resource flow paths for scheduling/sequencing. The results from the simulation models developed can directly assist in capacity planning and conducting or monitoring processes with the objective of resource allocation that could be limited. For instance, given that vendors face discrete demand in dynamic quantities in an infinite time horizon, different studies have developed efficient algorithms to find the optimal ordering policy. These algorithms calculate the scheduling and the order quantity from the vendor to the supplier to minimize the cost function over an infinite time horizon [24], which contributes to capacity planning.
Some studies examine the optimal resource allocation in time-reservation systems [25]. Customers arrive at a service facility and receive service in two steps; in the first step, information gathered from the customer is sent to a pool of computing resources, and in the second step, the data is processed after which the customer leaves the system. The decision-maker must decide when to reserve computing power from the pool of resources, such that the customer does not have to wait for the start of the second service step. Moreover, processing capacity is not wasted due to the customer still being serviced in the first step. The decision-maker simultaneously decides how many processors to allocate for the second processing step such that reservation and holding costs are minimized. Given that a detailed analysis of the system is complicated, the authors broke it into two parts, which are solved sequentially, leading to nearly optimal solutions.
A large amount of research has been conducted in the field of patient flows as well as resource allocation [8]. Multiple performance measures associated with healthcare systems make simulation particularly well-suited to tackle problems in this domain [26]. In this field, the increasing percentage of the aging population and the changing financial policies in the healthcare systems put governments under pressure to optimize their healthcare expenditures without compromising quality [22]. One way to cut down the costs is by improving and optimizing the facility management processes. Some operations apply the lean principles to service management processes to identify the value-added and non‐value-added activities in the process of health care provision [27]. Simulations were used to quantify the impact of the lean principles proposed. Thus, in this field, simulation is an effective tool in the selection of optimum resources for the service management process. The implementation of lean principles and simulations will help the facility manager in the selection of the optimum crew size in various sub-processes, thus eliminating the trial and error approach. Although applications range from manufacturing to services in many fields, this paper contributes to the management of the efficiency of service levels for the selection and implementation of a POS of a company providing financial products.
Modeling Approach
DES is a method in which the processes of the system are modeled by events, allowing users to analyze individual events [28], [29]. DES enables the user to explore progression through several experiments. It is often used to represent systems at an operational level, where individual interactions and the variation of experience of system entities over time are essential [30]. DES utilizes a mathematical/logical model of a physical system that portrays state changes at precise points in simulated time. The state change and the time at which it occurs require a detailed description. Customers waiting for service are specific domains of DES; therefore, this methodology of modeling is used in this paper.
A discrete system is one in which the state variation changes only at a discrete set of points in time. For example, the number of customers in the waiting line varies when a customer arrives or when the service provided to a customer is completed, implying that the variable changes only at discrete points in time. DES models are analyzed by numerical methods rather than by analytical methods. It means that DES employs computational procedures to solve mathematical models. In the case of simulation models, which use numerical methods, models are run rather than solved, that is, an artificial history of the system is generated from the model assumption and observations are collected to be analyzed and estimate the actual system performance measures [29].
Conceptualization
Point of Sale (POS)
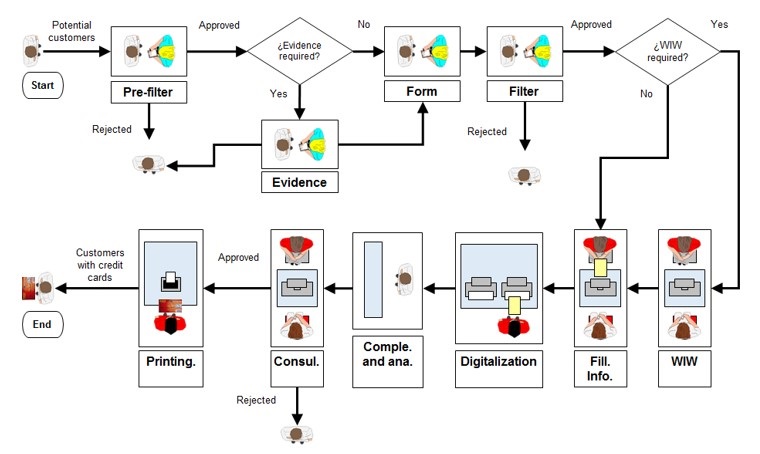
This process is outsourced by people using portable devices that allow them to move around the warehouse to identify potential customers. The following are the stages of this process:
Pre-filter: Review of raw data and the amount of the customer’s income; a classification is made that influences the type of support documents to be requested.
Evidence: Consultation of central risk offices (report to lenders).
Form Diligence: Requirement for the study of the allocation of credit on the card of the client.
Filter: The product quota (credit value and possible credit quota) is calculated and finally indicates the documents to be attached.
Commercial Consulting
The commercial consultants perform this process at the point of sale. The completion and analysis stages are carried out by an outsourcing and by the Credit Area. The following are the stages of this process:
Who is Who (WIW): Some clients must perform an identity validation called enrollment, in which their identity is verified through fingerprint digitization.
Filing Information: The data of the customer’s request is entered through the Bank’s software.
Digitalization: Digitalization of the documents of the client is done to carry out the study of the application.
Completion and Analysis: The credit area of the bank conducts the study of the customer based on the information and documents filed.
Consultation of Approval: Through the credit software of the bank, the status of the application is verified, receiving a confirmation via email and the approved amount (credit limit).
Credit Card Printing: Validation of the identity of the customer through identity document and the information registered in the bank’s software, then perform the opening, activation, printing, and delivery of the credit card to the customer.
Process Characterization
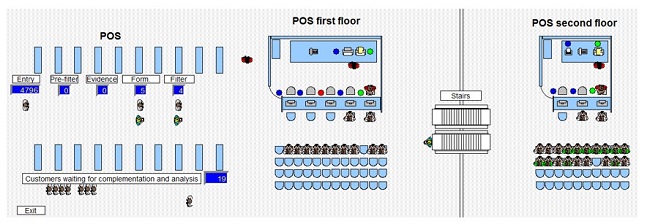
The process consists of two stages: sales and commercial advisory. On the one hand, the sale comprises the search of potential customers in the warehouse and delivery of the customer to the point of sale, as illustrated in figure 1. On the other hand, the commercial adviser performs the validation of the client identification and the filing of a request until the credit card is delivered or denied.
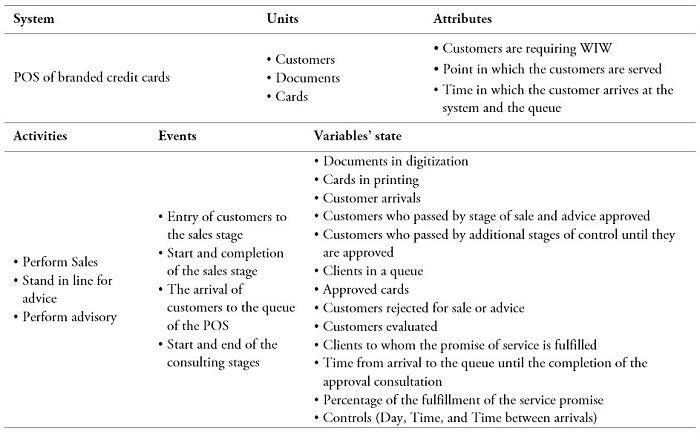
System Components
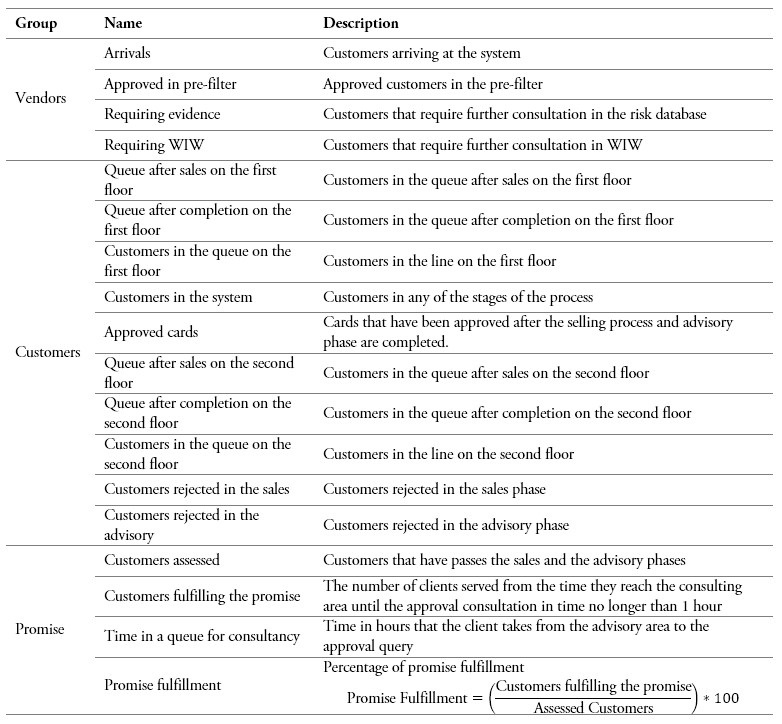
Table 1 presents the main components of the simulated system. These components allow the simulation model to be programmed.
Data Collection
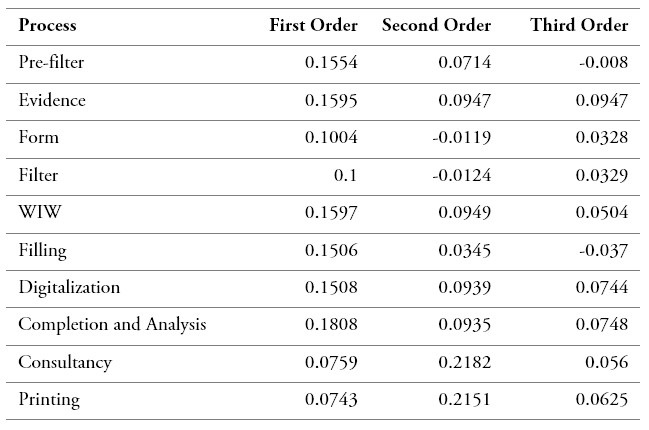
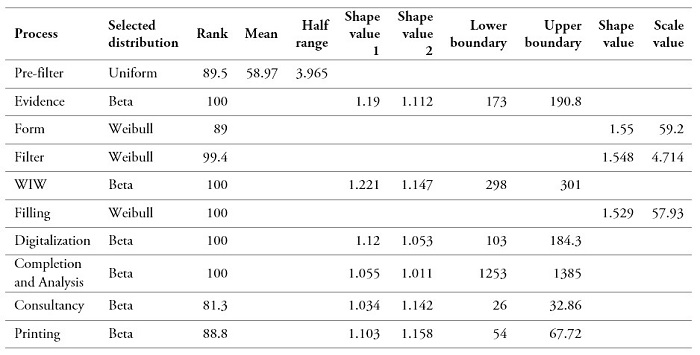
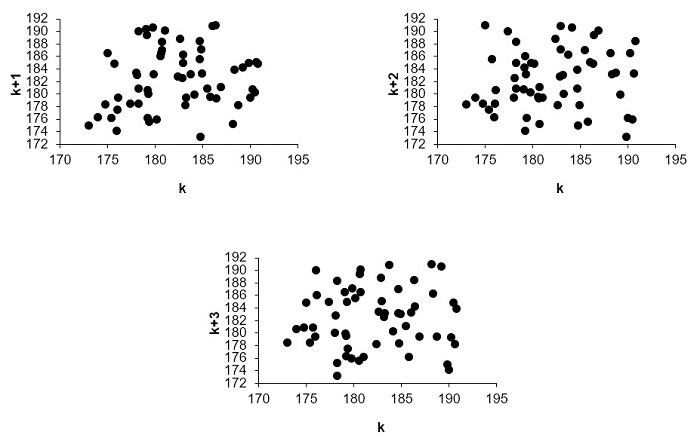
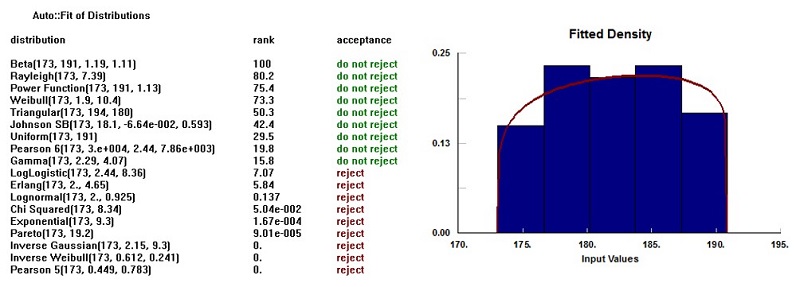
In the analysis of the service times in the simulation model, at least 30 samples were taken in the bank’s testing area because it was a process for the launch of a new point of sale. The summary of the analysis performed is shown in tables 2 (test of independence) and 3 (goodness of fit tests). An example of these tests applied to a particular variable is shown in appendix (see figures A1 and A2). Note that a majority of the distributions correspond to Beta because of the time available for the simulation study limited the necessary data collection. Thus, the Beta distribution is used as a rough model in the absence of data. However, some properties of the Beta distribution for certain combinations facilitate generating a Beta random variable (e.g., time to complete a task). As argued by Law and Kelton [31], if X~ beta (α1, α2), then 1 – X ~ beta (α1, α2), so the Beta distribution can easily generate beta random changes by the inverse-transform method.
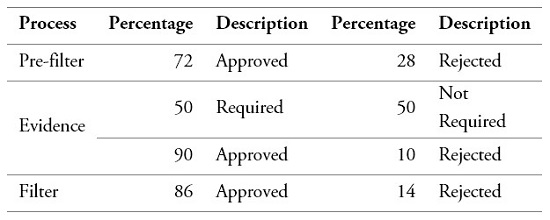
The percentages of the clients served through the processes and rejected at different stages were calculated based on historical data from the Bank’s Credit Management, as illustrated in table 4.
Model Development
Layout
The warehouse modeled is divided into the following areas:
POS: Area in which customers are approached by vendors who offer them the credit card.
POS first floor: Space in which there are five servers installed and two multifunctional machines for the attention of the customers who pass the sale stage.
POS second floor: Space in which there are three servers, a multifunctional machine, and a credit card printer. In this area, the approval and printing of credit cards (if applicable) are carried out. This area serves customers after the sales stage when the queue of the first-floor POS is more than ten customers.
Figure 2 shows the areas within the simulation software based on the drawings of the facilities of the warehouse.
Performance Measurements
For the analysis of the simulated system, this paper used the “compliance promise” as a measurement of performance for the sales and advisory phases. This measurement considers the promise of expected service by the financial institution, which is that no less than 80 % of clients are served within one hour of entering the advisory stage until they return for the credit card approval result, as illustrated in table 5.
Additional Conditions of the Simulation
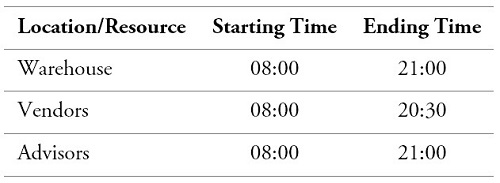
The sales hours are cut-off half an hour before the warehouse closes, to allow the advisors to attend the customers without greatly exceeding the additional time after the closing. The vendors have 30 minutes for lunch and three 5-minute breaks distributed during the day to go to the bathroom. These breaks are carried out interchangeably between the vendors. They cannot take a break until customer service is completed. The attention times were defined as shown in table 6.
As for the attention of customers who passed the stage of sale, they are taken by the vendor to the point of sale on the first floor. If the queue on the first floor has more than ten customers, the vendor takes the customer to the second-floor outlet. The delivery of the cards is made at the point of sale on the second floor.
Model Verification and Validation
The simulation model correctly represents the system. To do this, we calculated the number of replications and the length of the replications. We conducted a hypothesis test to validate the output data obtained from the simulation for the main performance measure of the system (service promise).
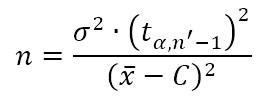
The Welch procedure is used to calculate the number of replications, which recommends the following steps: perform a test run of size n (recommended between 5 and 10), calculate the mean and variance of the sample, define a level of significance, and finally calculate the replication number using the following equations:
 (1)
(1)
𝑥̅: The average of the test runs
C: Historical performance measure
𝜎2: Variance of the test runs
𝑛′: Number of test replications
𝑡𝛼,𝑛′−1: Value of the distribution t
α: Significance level for the t distribution
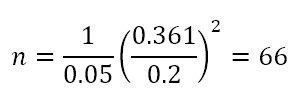
With a test number of replications n’ = 7 and a historical performance measure of (the promise of service) C = 0.82, values of 𝑥̅ = 0.762, 𝜎2 = 0.131 are obtained. Additionally, with a significance level α = 0.05, the value of the distributiont is t0,05,6 = 1,943. In this way, the replications number is:
 (2)
(2)With the Tchebycheff theorem we calculate the length of the replication (n), as shown in the following equation:
 (3)
(3)
α: Reject level
s: Standard deviation
∈: Rank
An initial run of size n’ = 10 was performed to estimate the standard deviation of the service promise (getting a result of s = 0.361), with a range of ± 0.2 and an acceptable level of 95 % (1 – α).
 (4)
(4)As part of the validation of the simulation model, a hypothesis test F is carried out for the service level performance measurement (historical data vs. simulation data), which is shown below:
H0 = there are no significant differences between the historical promise of service and that obtained by the simulation model
H1 = there are significant differences between the historical promise of service and that obtained by the simulation model
With a significance level α = 0.05
 (5)
(5)
Decision: Does not reject the null hypothesis.
Conclusion: With a significance level α = 0.05, the decision is not to reject the null hypothesis. Thus, the validation model concludes that the values obtained between the simulation model and historical data do not show a significant difference between the values obtained in the simulation model and the historical data for the performance measurement (the promise of service).
Model Simulation
To select the alternatives to be simulated, the time between arrivals and the number of servers in the system were varied so that the performance measure “fulfillment of the service promise” could be evaluated. With the above, we obtained the combination of five scenarios for the time between arrivals and fifteen scenarios for the number of vendors. The simulation was carried out with the number of replications and the length of the replications described above.
Time Between Arrivals
Based on the information on the estimated arrivals made by the Marketing Department of the financial entity, five scenarios with differences in the time between arrivals were determined, which allowed evaluating the behavior of the fulfillment of the defined service promise. To perform the run of the scenarios in the simulation software, intervals per scenario were included, as illustrated in table 7, showing an estimated initial demand scenario (100 %), from a decrease (300 %) to an increase in this service demand (-300 %).
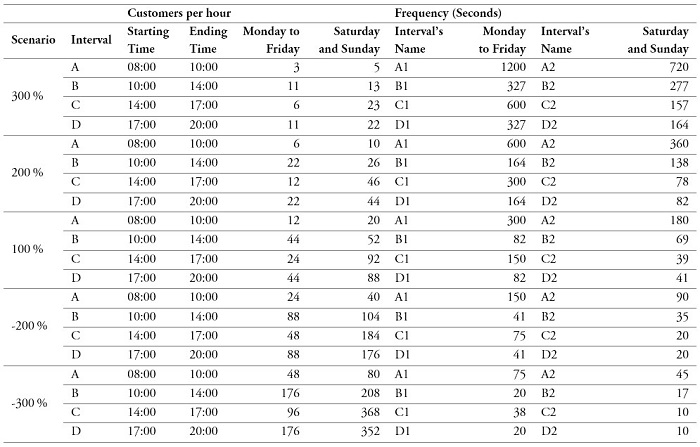
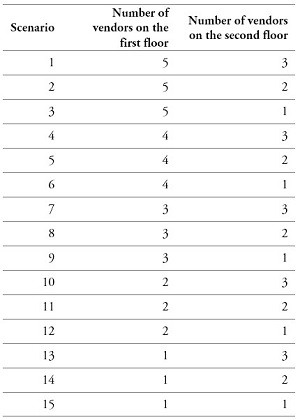
Number of Vendors
Table 8 presents the run of the different scenarios between arrivals. The combinations of vendors for the first and second floors performed according to the capacity of the point of sale facilities.
Results
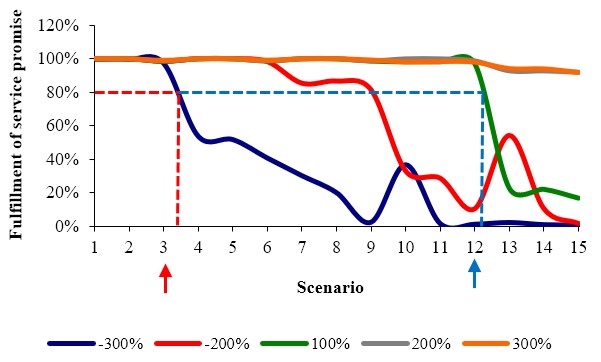
Based on the simulation model, the graphs named Service Isoquants were obtained. These isoquants allow us to observe the behavior of the performance measure of interest with the different combinations of vendors at the points of sale. Figure 3 presents scenarios 3 and 12 that fulfill the 80 % service promise for the -300 % demand and the 100 % demand, respectively.
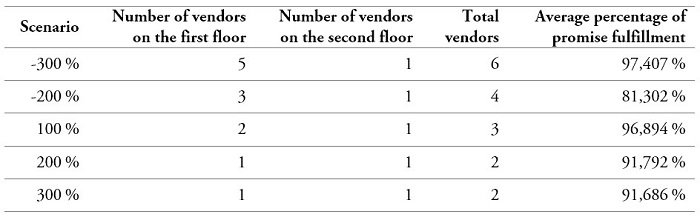
Through the results of the simulation model, the minimum number of advisors required to the service promise fulfillment per scenario is obtained (see table 9).
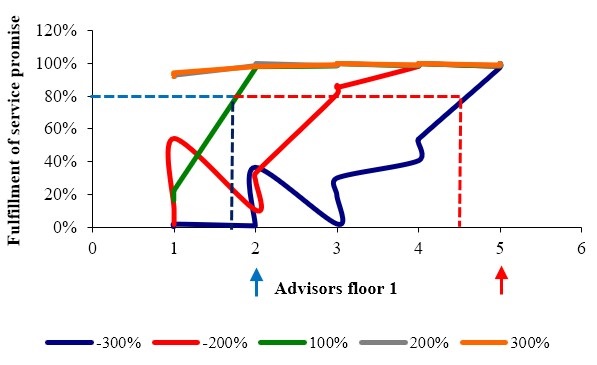
The isoquants of service by the vendor for the facilities of the warehouse in floor 1 support the result obtained in figure 3—for -300 % of the demand two commercial advisers are required. In comparison, 100 % of the demand needed five consultants (see figure 4).
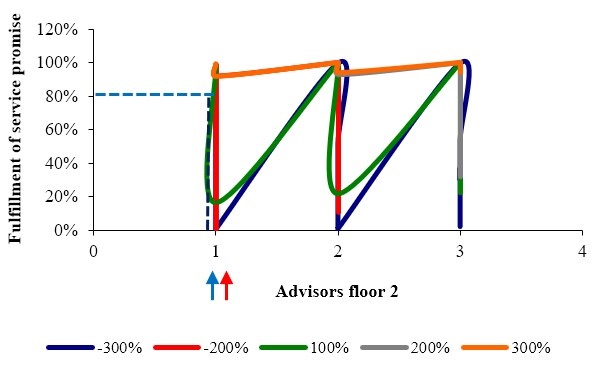
Similarly, service isoquants per commercial adviser for warehouse facilities on the second floor support the result obtained in figure 3, since for both the -300 % and the 100 % demand, a commercial adviser is required (see figure 5).
Conclusions and Discussion
Through the literature review, applications in manufacturing processes, services, and their combinations are identified, using discrete event simulation [29], [31]. This paper presents a proposal for the analysis of the workers’ allocation in services processes. From the variations in the service demand, the simulation model calculates the required workers. In this sense, the service isoquants show the resources tradeoff between resource allocation and client flow for the fulfillment of the service promise. Results show that scenario 3 fulfills the service promise by 97.4 % and scenario 12 by 96.89 %, providing the minimum number of advisors required for the service promise fulfillment estimated according to the initial demand scenario (100 %) and an increase in service demand (-300 %). These results contribute to improve quality of service and job satisfaction; therefore, this study helps to refine some of the issues discussed from previous studies [32].
Discrete simulation models can be used for the calculation of resources in the presentation of services (facilities, labor, equipment, technology, etc.), according to the market requirements and especially the levels of service expected by the client and aiming for the reduction of the costs derived from the execution of the operations. From the results obtained, both -300 % and 100 % of the demand require two commercial advisers and five consultants, respectively. These results show how the simulation and isoquant mapping contribute to overcome the cost-minimization problem of resource allocation. Thus, the results of the simulation model can be used as support to calculate the required number of commercial advisers as well as points of sale to be opened by the expansion of the operation of the warehouse. This paper contributes to extend the results obtained by Becerra-Fernandez et al. [1], [5], [6].
With the development of the simulation model for the point of sale of the financial institution in the case study, it is possible to observe the behavior of the measure of performance of interest (percentage of fulfillment of the promise of service) with different combinations of allocations of resources, in this case, commercial advisers and facilities related to each position (either vendor or advisor).
A computer-based system allows assessing decision alternatives on the dimension of the capacity and performance indicators . This paper proposes a novel performance indicator based on service promise applied to a financial institution. In the case study addressed in this paper, the scenario simulation allows decision-makers in the financial institution to establish the resource requirement for the fulfillment of a given service promise according to variations in demand (potential customers at the point of sale).
Future research can be oriented to address the development of service isoquants in other operations of companies providing services, following the steps established in this paper.
References
[1] M. Becerra-Fernández, E. C. G. La Rotta, M. M. H. Ramírez, and O. R. R. Quiroga, “Collaborative planning capacities in distribution centers,” in Theory, Methodology, Tools and Applications for Modeling and Simulation of Complex Systems, L. Zhang, X. Song, and Y. Wu, Eds. Singapore: Springer Singapore, 2016, Part I, pp. 622–632.
[2] A. Crespo, C. Bianchi, and J. Gupta, “Operational and financial effectiveness of e-collaboration tools in supply chain integration,” Eur. J. Oper. Res., vol. 159, pp. 348–363, 2004. doi: 10.1016/j.ejor.2003.08.020
[3] K. Kloos and R. Pibernik, “Allocation planning under service-level contracts,” Eur. J. Oper. Res., vol. 280, no. 1, 2019. doi: 10.1016/j.ejor.2019.07.018
[4] Y. Jiang and A. Seidmann, “Capacity planning and performance contracting for service facilities,” Decis. Support Syst., vol. 58, no. 1, pp. 31–42, 2014. Available: https://doi.org/10.1016/j.dss.2013.01.010
[5] E. C. González-La Rotta and M. Becerra-Fernandez, “Cross-docking with vehicle routing problem. A state of art review,” DYNA, vol. 84, no. 200, pp. 271–280, 2017. doi: 10.15446/dyna.v84n200.60868
[6] M. Becerra-Fernandez and R. Rodriguez-Yee, “Selection of Alternatives for the natural gas supply in Colombia using the analytic hierarchy process,” Ing., vol. 22, no. 2, May 2017. Available: http://dx.doi.org/10.14483/udistrital.jour.reving.2017.2.a02
[7] M. Becerra-Fernandez, F. Cosenz, and I. Dyner, “Modeling the natural gas supply chain for sustainable growth policy,” Energy, vol. 205, p. 118018, 2020. Available: https://doi.org/10.1016/j.energy.2020.118018
[8] J. B. Jun, S. H. Jacobson, and J. R. Swisher, “Application of discrete-event simulation in health care clinics: A survey,” J. Oper. Res. Soc., vol. 50, no. 2, pp. 109–123, Feb. 1999. Available: 10.1057/palgrave.jors.2600669
[9] W. Trigueiro de Sousa Junior, J. A. Barra Montevechi, R. de Carvalho Miranda, and A. Teberga Campos, “Discrete simulation-based optimization methods for industrial engineering problems: A systematic literature review,” Comput. Ind. Eng., vol. 128, no. December 2018, pp. 526–540, 2019. Available: https://doi.org/10.1016/j.cie.2018.12.073
[10] N. Furian, M. O’Sullivan, C. Walker, and S. Vössner, “Evaluating the impact of optimization algorithms for patient transits dispatching using discrete event simulation,” Oper. Res. Heal. Care, vol. 19, pp. 134–155, 2018. Available: https://doi.org/10.1016/j.orhc.2018.03.008
[11] T. B. T. Nguyen, A. I. Sivakumar, and S. C. Graves, “Capacity planning with demand uncertainty for outpatient clinics,” Eur. J. Oper. Res., vol. 267, no. 1, pp. 338–348, 2018. doi: 10.1016/j.ejor.2017.11.038
[12] A. R. Heching and M. S. Squillante, “Optimal capacity management and planning in services delivery centers,” Perform. Eval., vol. 80, no. C, pp. 63–81, 2014. Available: https://doi.org/10.1016/j.peva.2014.01.003
[13] J. C. Chen, T. L. Chen, and H. Harianto, “Capacity planning for packaging industry,” J. Manuf. Syst., vol. 42, pp. 153–169, 2017.
[14] F. D. Ramalho, P. Y. Ekel, W. Pedrycz, J. G. Pereira Júnior, and G. L. Soares, “Multicriteria decision making under conditions of uncertainty in application to multiobjective allocation of resources,” Inf. Fusion, vol. 49, no. March 2018, pp. 249–261, 2019.
[15] D. J. van der Zee, “Model simplification in manufacturing simulation: Review and framework,” Comput. Ind. Eng., vol. 127, no. October 2018, pp. 1056–1067, 2019. doi: 10.1016/j.cie.2018.11.038
[16] T. L. Garwood, B. R. Hughes, M. R. Oates, D. O’Connor, and R. Hughes, “A review of energy simulation tools for the manufacturing sector,” Renew. Sustain. Energy Rev., vol. 81, no. August 2017, pp. 895–911, 2018.
[17] D. Mourtzis, M. Doukas, and D. Bernidaki, “Simulation in manufacturing: Review and challenges,” Procedia CIRP, vol. 25, no. C, pp. 213–229, 2014. Available: https://doi.org/10.1016/j.procir.2014.10.032
[18] A. Greasley, “Using system dynamics in a discrete-event simulation study of a manufacturing plant,” Int. J. Oper. Prod. Manag., vol. 25, no. 6, pp. 534–548, 2005. doi: 10.1108/01443570510599700
[19] S. C. Brailsford, T. Eldabi, M. Kunc, N. Mustafee, and A. F. Osorio, “Hybrid simulation modelling in operational research: A state-of-the-art review,” Eur. J. Oper. Res., vol. 278, no. 3, pp. 721–737, 2019. Available: https://doi.org/10.1016/j.ejor.2018.10.025
[20] J. Orjuela, M. M. Herrera, and W. Casilimas, “Impact analysis of transport capacity and food safety in Bogota,” in 2015 Workshop Engineering Application: International Congress on Engineering (WEA). Bogotá: IEE, 2015, pp. 7–13.
[21] Y. M. Lee et al., “Discrete event simulation modeling of resource planning and service order execution for service businesses,” in Proc. 2007 Conf. Winter Simul., S. G. Henderson, B. Biller, M.-H. Hsieh, J. Shortle, J. D. Tew, and R. R. Barton, Eds. 2007, pp. 2227–2233. Available: https://citeseerx.ist.psu.edu/viewdoc/download?doi=10.1.1.172.1725&rep=rep1&type=pdf
[22] R. Harpring, G. W. Evans, R. Barber, and S. M. Deck, “Improving efficiency in social services with discrete event simulation,” Comput. Ind. Eng., vol. 70, no. 1, pp. 159–167, 2014. Available: https://doi.org/10.1016/j.cie.2014.01.016
[23] H. Zhang and H. Li, “Simulation-based optimization for dynamic resource allocation,” Autom. Constr., vol. 13, no. 3, pp. 409–420, 2004.
[24] M. Afzalabadi, A. Haji, and R. Haji, “Vendor’s optimal inventory policy with dynamic and discrete demands in an infinite time horizon,” Comput. Ind. Eng., vol. 102, pp. 368–373, 2016. Available: https://doi.org/10.1016/j.cie.2016.06.024
[25] R. Yang, S. Bhulai, R. van der Mei, and F. Seinstra, “Optimal resource allocation for time-reservation systems,” Perform. Eval., vol. 68, no. 5, pp. 414–428, May 2011. doi: 10.1016/j.peva.2011.01.003
[26] C. Baril, V. Gascon, J. Miller, and N. Côté, “Use of a discrete-event simulation in a Kaizen event: A case study in healthcare,” Eur. J. Oper. Res., vol. 249, no. 1, pp. 327–339, 2016. Available: https://doi.org/10.1016/j.ejor.2015.08.036
[27] V. Sharma, J. Abel, M. Al-Hussein, K. Lennerts, and U. Pfründer, “Simulation application for resource allocation in facility management processes in hospitals,” Facilities, vol. 25, no. 13–14, pp. 493–506, 2007. Available: https://doi.org/10.1108/02632770710822599
[28] G. A. Wainer, Discrete-event modeling and simulation: a practitioner’s approach. Boca Raton, FL: CRC, 2017.
[29] J. Banks, J. S. Carson II, B. L. Nelson, and D. M. Nicol, Discrete-event system simulation. United States: Pearson, 2005.
[30] J. P. Davis and C. B. Bingham, “Developing theory through simulation methods,” Acad. Manag. Rev., vol. 32, no. 2, pp. 480–499, 2007. Available: https://doi.org/10.5465/amr.2007.24351453
[31] A. M. Law and D. Kelton, Simulation Modeling and Analysis, 3rd edit. Singapore: McGraw Hill, 2000.
[32] I. W. Gibson, “An approach to hospital planning and design using discrete event simulation,” Proc. Winter Simul. Conf., pp. 1501–1509, 2007. doi: 10.1109/WSC.2007.4419763
[33] J. Trujillo-Díaz, M. M. Herrera, and F. N. Díaz-Piraquive, “A computer-based decision support system for knowledge management in the swine industry,” Int. J. Grid Util. Comput., vol. “In press,” 2020.
Appendix
Notes
*
Research article
Author notes
a Corresponding author. E-mail: mbecerra@ucatolica.edu.co
Additional information
How to cite this article: M. Becerra-Fernandez, M. M. Herrera, C. Trejos, and O. R. Romero, “Resources allocation in service planning using discrete-event simulation,” Ing. Univ., vol. 25, 2021. https://doi.org/10.11144/Javeriana.iued25.rasp
