


APA
ISO 690-2
Harvard
Haga clic en un formato de citación
Comparative Study of Analytical and Adaptive Thermal Comfort Models in Tropical Classrooms*
Estudio comparativo de modelos analíticos y adaptativos de confort térmico en aulas tropicales
Carlos Herrera ![]() , Gustavo San Juan
, Gustavo San Juan ![]() , Olga Lucía Montoyaa
, Olga Lucía Montoyaa ![]()
Comparative Study of Analytical and Adaptive Thermal Comfort Models in Tropical Classrooms*
Ingeniería y Universidad, vol. 28, 2024
Pontificia Universidad Javeriana
Carlos Herrera
Universidad del Valle, Colombia
Gustavo San Juan
Universidad Nacional de La Plata, Argentina
Olga Lucía Montoyaa a olgaluciamontoyaflorez1972@gmail.com
Universidad de San Buenaventura, Colombia
Received: 15 november 2020
Accepted: 19 november 2024
Published: 30 december 2024
Abstract:
Objective: This paper presents the findings of a study of thermal comfort in naturally ventilated classrooms in four typical schools in the city of Cali, Colombia, South America. It was carried out in a hot tropical climate without seasons and in rainy and dry periods. Materials and methods: A total of 535 students between 6 and 12 years of age were surveyed about their thermal sensation. Simultaneously, indoor and outdoor environmental parameters air temperature, relative humidity, wind speed, and surface radiant temperature were measured, and clothing insulation and metabolic rate values were based on the standard. Results and discussion: The results were compared with the PMV and adaptive models, indicated by the ASHRAE 55 standard, and indicate that neither model reflects the perceived comfort in the classroom between 23 ≤ To ≤ 27.6 °C; the PMV because it predicts discomfort above To = 26 °C, and the adaptive because it presents a tolerance threshold that is too wide, 80 % of acceptability at To = 30.4 °C, where everything is below comfort. Conclusion: The conclusion was reached that the two models proposed by the international standard ASHRAE and the Colombian Technical Standard NTC 5316 adjust little to the situation observed in the study and therefore do not allow adequate design decisions to generate comfortable spaces.
Keywords:Thermal Comfort, Analytical Model, Adaptive Model, Naturally Ventilated Classrooms.
Resumen:
Objetivo: este trabajo presenta los resultados de un estudio de confort térmico en aulas ventiladas naturalmente en cuatro colegios típicos de la ciudad de Cali, Colombia, Suramérica. Se realizó en un clima tropical cálido sin estaciones y en periodos lluviosos y secos. Materiales y métodos: un total de 535 estudiantes entre 6 y 12 años de edad fueron encuestados sobre su sensación térmica. Simultáneamente, se midieron los parámetros ambientales interiores y exteriores de temperatura del aire, humedad relativa, velocidad del viento y temperatura radiante de la superficie, y los valores de aislamiento de la ropa y la tasa metabólica se basaron en la norma. Resultados y discusión: los resultados se compararon con los modelos PMV y adaptativo, indicados por la norma ASHRAE 55, e indican que ninguno de los dos modelos refleja el confort percibido en el aula entre 23 ≤ To ≤ 27,6 °C; el PMV porque predice incomodidad por encima de To = 26 °C, y el adaptativo porque presenta un umbral de tolerancia demasiado amplio, 80 % de aceptabilidad a To = 30,4 °C, donde todo está por debajo del confort. Conclusiones: se llegó a la conclusión de que los dos modelos propuestos por la norma internacional ASHRAE y la Norma Técnica Colombiana NTC 5316 se ajustan poco a la situación observada en el estudio y, por lo tanto, no permiten tomar decisiones de diseño adecuadas para generar espacios confortables.
Introduction
The Colombian Technical Standard (NTC) 5316: Thermal Environmental Conditions of Properties for People [1], an identical translation (IDT) of ASHRAE 55 [2], regulates the comfort conditions in buildings. The NTC defines a comfort range for Colombia for summer in terms of its operating temperature (T°) of 22.5 °C < T° < 26 °C, relative humidity (RH) of 60 % and metabolic activity (met) of ≤ 1.2, where a maximum of 10 % of the population is unsatisfied.
The ASHRAE 55 standard uses the scale of thermal sensation: -3 cold, -2 cool, -1 slightly cool, 0 neutral, +1 slightly warm, + 2 warm, + 3 hot, and establishes two methods to determine comfort: analytical and adaptive. The latter is based on the average outdoor temperature and only applies to naturally ventilated conditions. The analytical model is based on the predicted mean vote (PMV) and the predicted percentage of dissatisfied (PPD), developed by Fanger [3]. This allows us to predict the average value of the thermal sensation of the occupants and the percentage that is satisfactorily comfortable. For this standard, the comfort range is defined as -0.5 < PMV < +0.5, with a PPD < 10 %.
On the other hand, for those who design classrooms in Colombia, the Colombian Technical Standard NTC 4595: Civil Engineering and Architecture. Planning and Design of School Facilities and Environments [4], defines the design guidelines to achieve thermally comfortable classrooms. In the two previous versions of the standard (2000 and 2015), it did not compromise with ranges or specific models of thermal comfort; however, in the third update [5], an important advance was proposed since the standard indicates a range of comfort under the adaptive model (not explicit), according to the average outdoor temperature, which results between 22.5 °C < T° < 28.5 °C. However, further study of thermal comfort requires referring to the NTC 5316 or the international ASHRAE standards mentioned above.
The ranges established in international standards have been questioned because they are the result of research under controlled climatic conditions, which do not necessarily correspond to reality. Authors such as Humphreys [6] and Oseland [7] reported that a group of people with the same clothes and activities can have different opinions regarding comfort; this group was developed by Matthews & Nicol [8] with factory workers in India. Other studies in buildings [9] concluded that universal methods for defining standards and calculating comfort are inadequate in the face of cultural and climatic variations.
Thermal comfort in schools began to be investigated in countries with differentiated climatic seasons, where comfort conditions are generated most of the year from the use of mechanical air conditioning systems. This situation is different from that in naturally ventilated environments. Several investigations have compared the thermal sensation of people in classrooms with that of air-conditioned and naturally ventilated [10][11].
Tablada et al. [10] noted that studies carried out in the last three decades in naturally ventilated schools at warm temperatures have shown that the thermal sensation during comfort is warmer than that indicated in the regulations [12] and that, in such environments, students can report 90 % and 78 % acceptability at temperatures of 30 °C [13] and 30.7 °C [14], respectively, which exceed the regulated ranges.
As the report indicates [15], the largest number of studies on thermal comfort in schools have been conducted at temperate temperatures (65 %), and only 20 % have been conducted in the tropics (or subtropics), such as Hawaii, Australia, Malaysia, Singapore, Thailand, Nigeria, Ghana and India, with few studies carried out in areas near the equator [16]. At the local level, these methods are very recent and insufficient [17][18], indicating the need to carry out and disseminate a greater number of investigations to establish in what proportion the predictions with the standardized methods correspond to reality to eventually propose adjustments or improvements.
Methods and Materials
The methodology used in the present study and the Environmental Audit of User Perception-AAPU [19] was carried out in two different months in 2017: a dry month (August) and a rainy month (April) in classrooms at the basic primary level located in the city of Cali, which is located 997 m above sea level, with a latitude of 3°27′00″N–76°32′00″W, a hot dry climate, with an average temperature >24°, and <75 % RH. The eight audited classrooms correspond to four public schools built after 2000, in accordance with the Colombian Technical Standard NTC 4595 [4], and govern the design conditions for comfortable classrooms as of that year. Two classrooms were selected per school, located on the ground and upper floors. The technological characteristics of the building envelope are resolved in blocks of ceramic brick (Figure 1) or concrete (Figures 2, 3 and 4), with a high percentage of permeability to the outside through large windows, shutters and drafts.

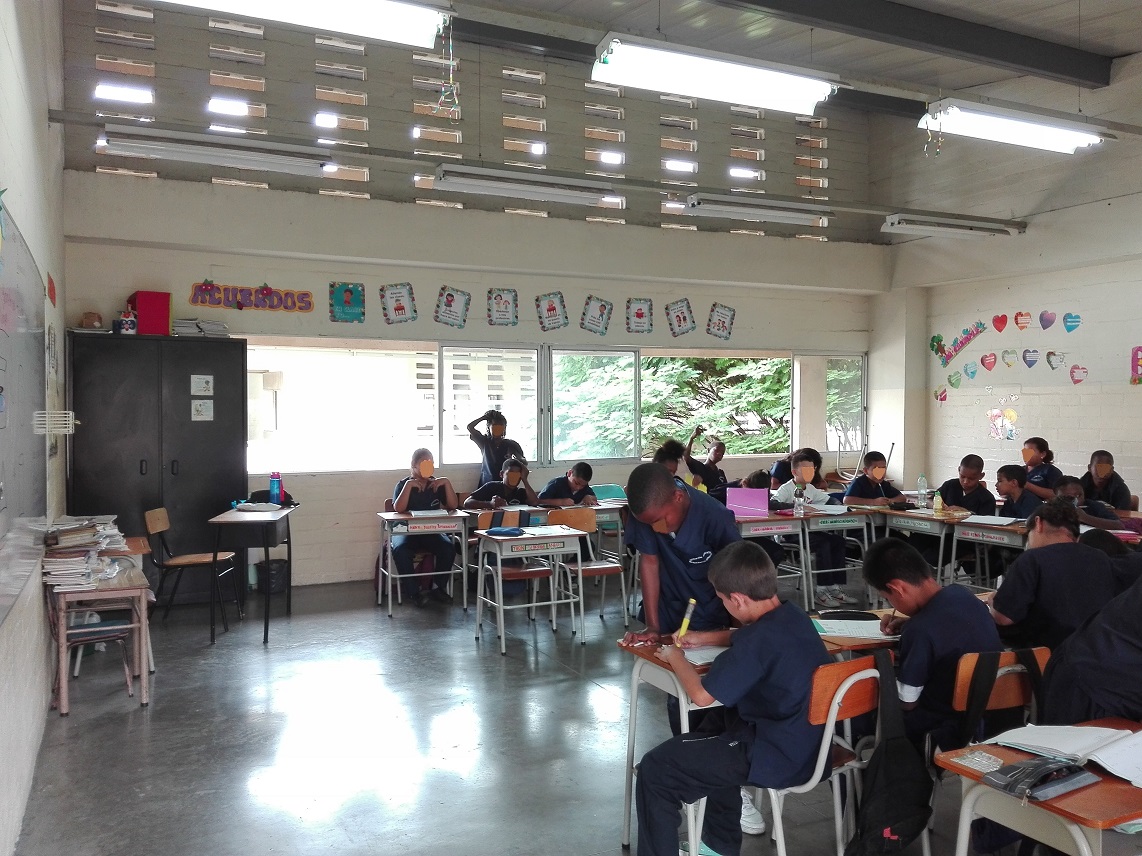
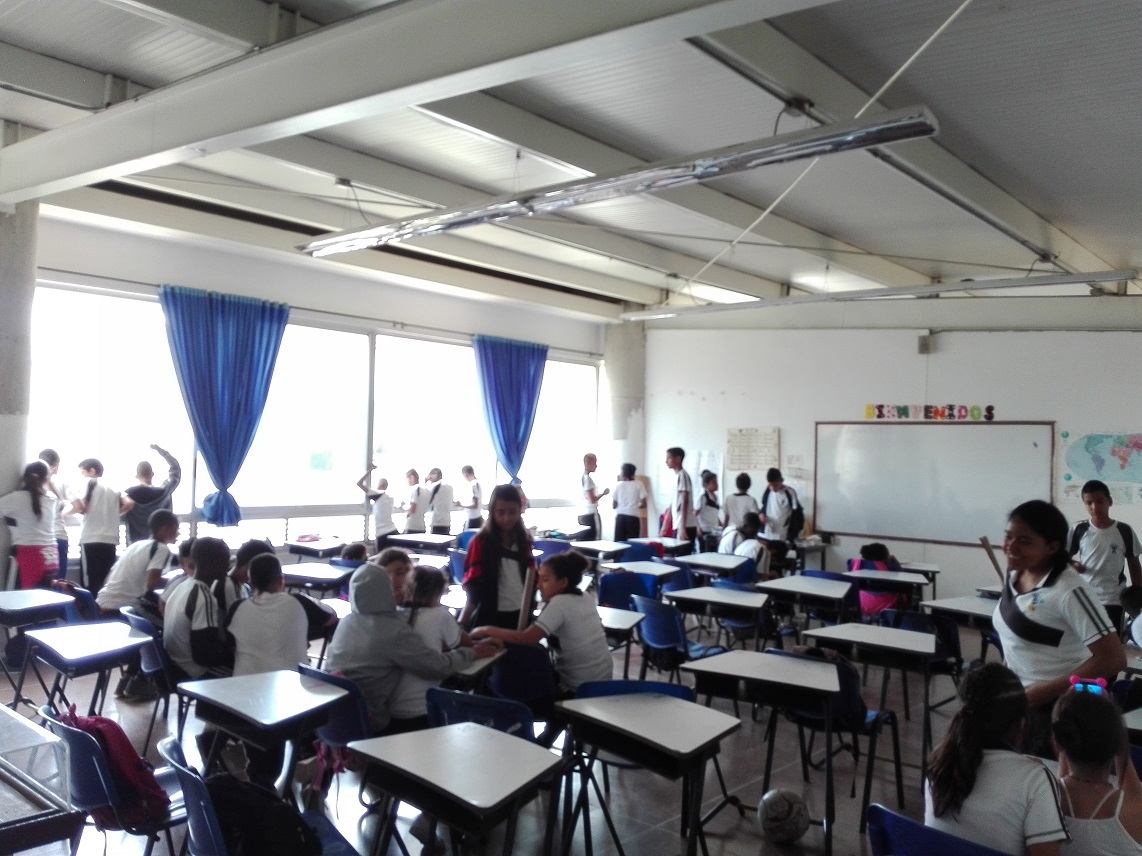
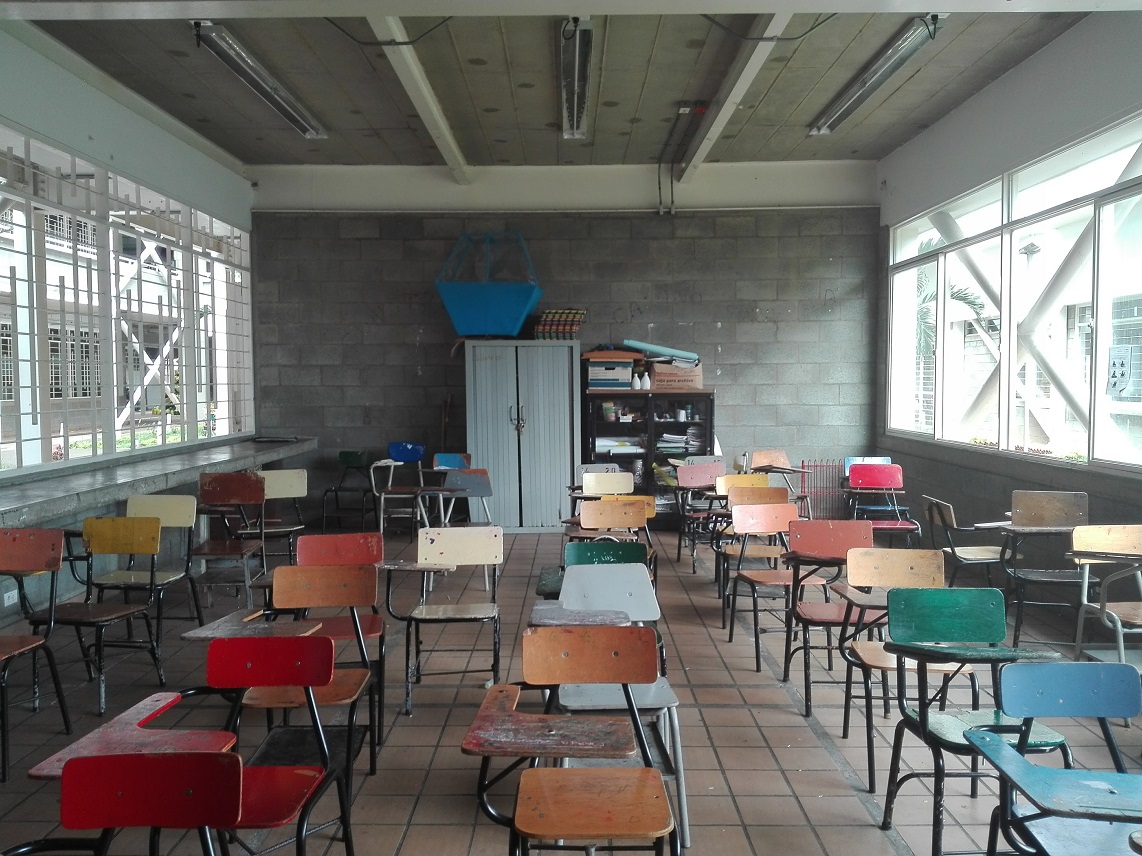
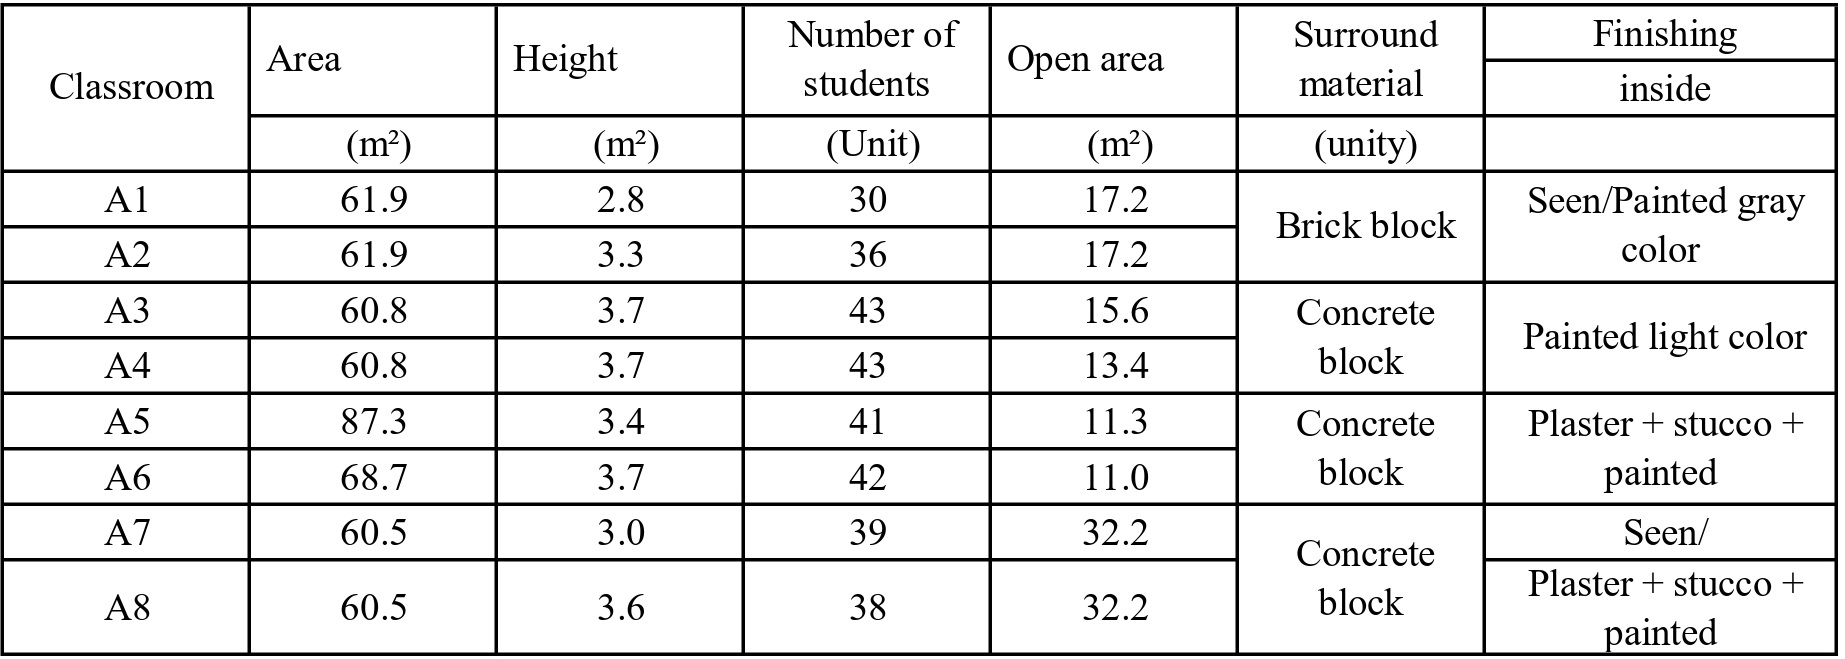
The classrooms have similar characteristics, typical of naturally ventilated spaces in the tropics (Table 1), with practical windows, air conditioning equipment, openings, shutters or bars that guarantee a direct relationship with the external environmental conditions.
Environmental Audit of User Perception–APPUEnvironmental Audit of User Perception–APPU
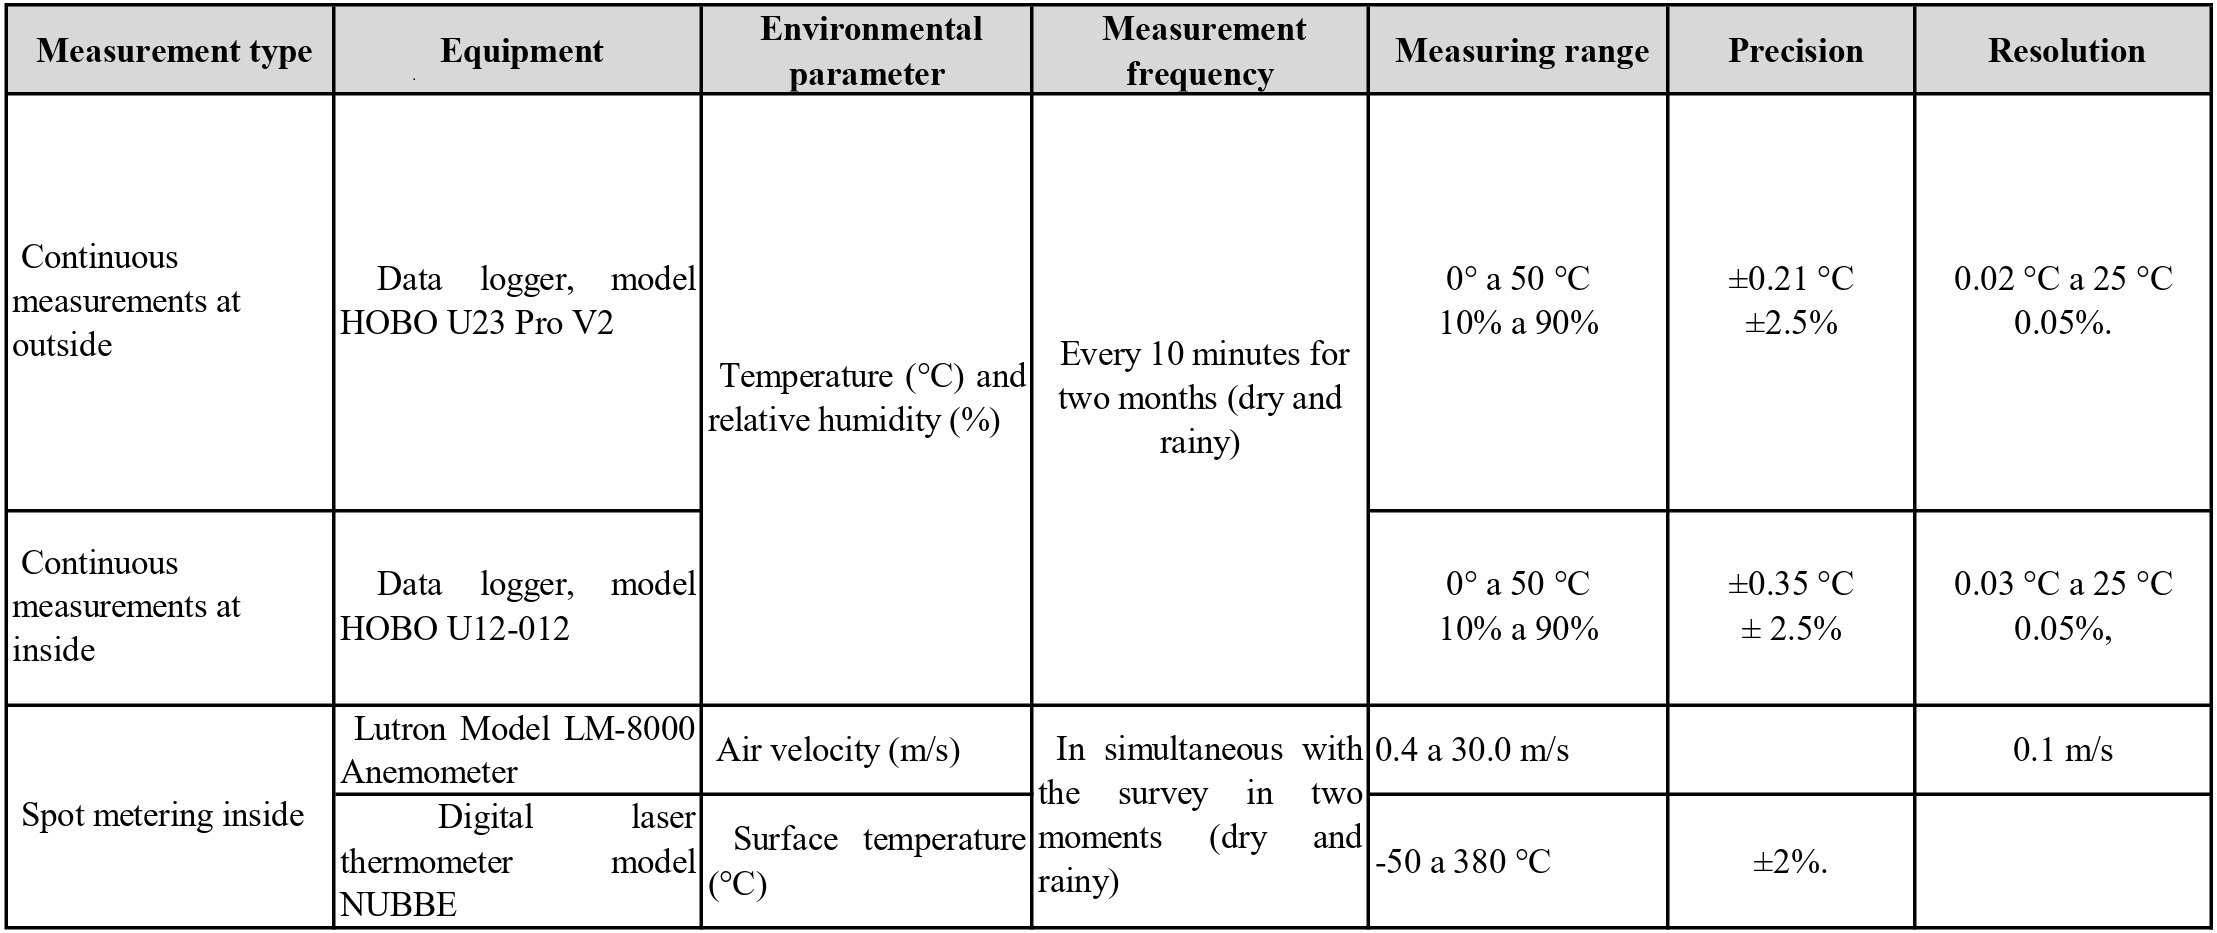
This methodology was previously validated in classroom studies in different Latin American countries [19]. The AAPU has two components: (i) the objective (physical dimension), which is based on the recording of environmental parameters, uses specific equipment according to the analysis variable, both outside and inside the rooms. The measurements were made with two types of frequencies: continuous (without interruptions during each month of analysis) and punctual at the time of the opinion survey. In Table 2, the specifications of the frequencies and the equipment used are presented.
The subjective component is based on the study of the perception of the occupants, derived from participatory workshops held between 9 am and 12 pm during the school day, from the implementation of a survey conducted through a participatory workshop, where 535 students between the ages of 8 and 16 were involved. The study considered clothing insulation values (clo) between 0.52 and 0.59, corresponding to typical summer clothing, and a metabolic rate of 1.2 met, which represents slightly sedentary activity, according to ASHRAE standards.
The AAPU, previously developed and applied in other classroom research [20], followed the guidelines of the Ethics Committee of the University of San Buenaventura, Cali. The survey included the following variables: (i) personal data; (ii) weather conditions; (iii) garment: according to the scale indicated by ASHRAE [2]; (iv) thermal sensation: very hot (+3), hot (+2), slightly hot (+1), neutral (0), slightly cool (-1), cool (-2) and cold (-3)[2], equal to the Votes of Thermal Sensation –VST; (v) previous activity, met, as indicated by ASHRAE; (vi) ventilation and air quality; and (vii) strategies to adapt to the thermal conditions, such as opening and closing windows, changing places in the classroom; (viii) sheltering more or less; and (ix) perception of ventilation to the interior and the most ventilated place in the room.
Thermal Comfort Processing. Analytical Model
The data collected in the environmental and comfort audits were incorporated into an Audit Processing System, Objective + Subjective (SISPA O + S) [22], in an open environment to facilitate systematization and processing, both numerical and graphic. The SISPA O + S allows us to establish a correlation between objective and subjective records and to integrate the different procedures and equipment carried out in a single processing environment.
For the comfort processing, the following values were calculated:
- VST average: weighted average of the VST-thermal sensation votes
- Average radiant temperature (Tmr): Based on values of form factors, emissivities and temperatures of each surface, through the software designed for this purpose [23], its value can be determined via Equation (1) proposed by ASHRAE:
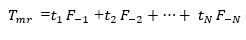 (1)
(1)
- where:
- t1 = Surface temperature surface 1
- F-1 = Surface form factor 1
- t2 = Surface temperature surface 2
- F-2 = Surface form factor 2
- = Surface temperature of each surface of the space
- F-N = Form factor of each surface of the space
- The operating temperature, according to Formula (2) indicated by ASHRAE:
 (2)
(2)
- where:
- To = Operating temperature
- T = Air temperature
- Tmr = Radiant temperature
- A (value as a function of air velocity) = 0.5 (< 0.2 m/s); = 0.6 (0.2 to 0.6 m/s); = 0.7 (0.6 to 1.0 m/s),[2]
- Neutral Temperature: linear regression models were developed from the thermal sensation votes of the classrooms in each of the measurement periods. From these, the crossing of the linear regression lines was identified, which shows the votes of thermal sensation (VST) and the neutral state (VST = 0), which indicates the neutral temperature (Tn) that represents the ideal state of temperature in which people are in comfort [24][25]. For the subject of thermal comfort, linear regressions were carried out to identify the relationships and effects between objective variables, such as To and RH %, and the students' thermal sensation.
Thermal Comfort Processing. Adaptive Model
The analysis under this model is possible, given the thermal conditions of the classrooms from the absence of mechanical means for cooling, where the value = 1.0 < met < 1.3, and between 0.5 < clo < 1.0, the average outside temperature between 10° < (T pma (ext) ) ̅ < 33.5 °C, where its occupants have the ability to adapt their clothing to the hygroscopic conditions of the indoor environment.
To determine the acceptable temperature or T. in terms of comfort (T accept ), the following Equation (3) is used [26]:
Taccept = 0.31 * Tpma (ext) 17.8 Tlim (3)
where:
Taccept = acceptable temperature
Tpma (ext) = Average monthly outdoor temperature
Tlim = 2.5 °C for 90 % acceptability and 3.5 °C for 80 % acceptability
Theoretical Models
To compare the thermal comfort perceived by the students reflected in the VSTs, with the predictions of the theoretical models, the CBE/ASHRAE Thermal Comfort Tool is used [27], explained in a comprehensive way in Standard 55 User’s Manual (2013) [28], used in thermal analysis in classrooms in the equatorial zone [29] and homes [30], and in the subtropical climate [13] in university classrooms.
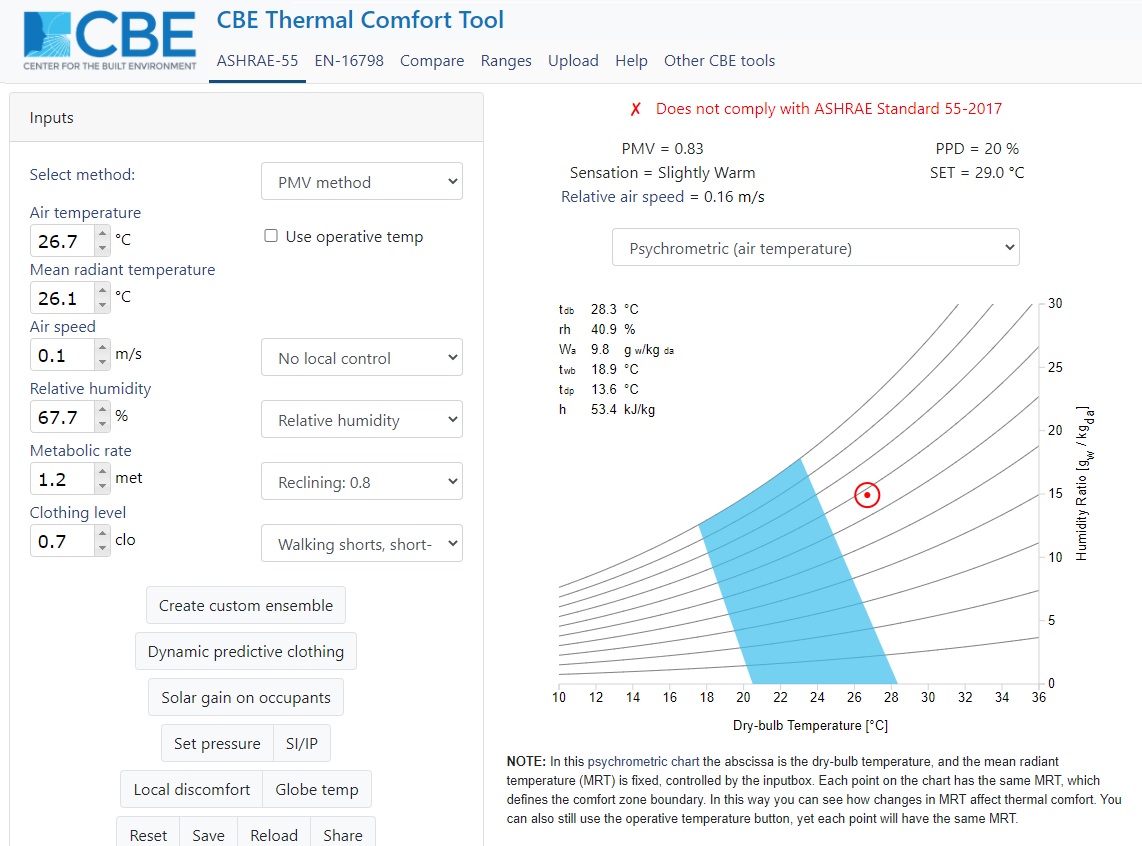
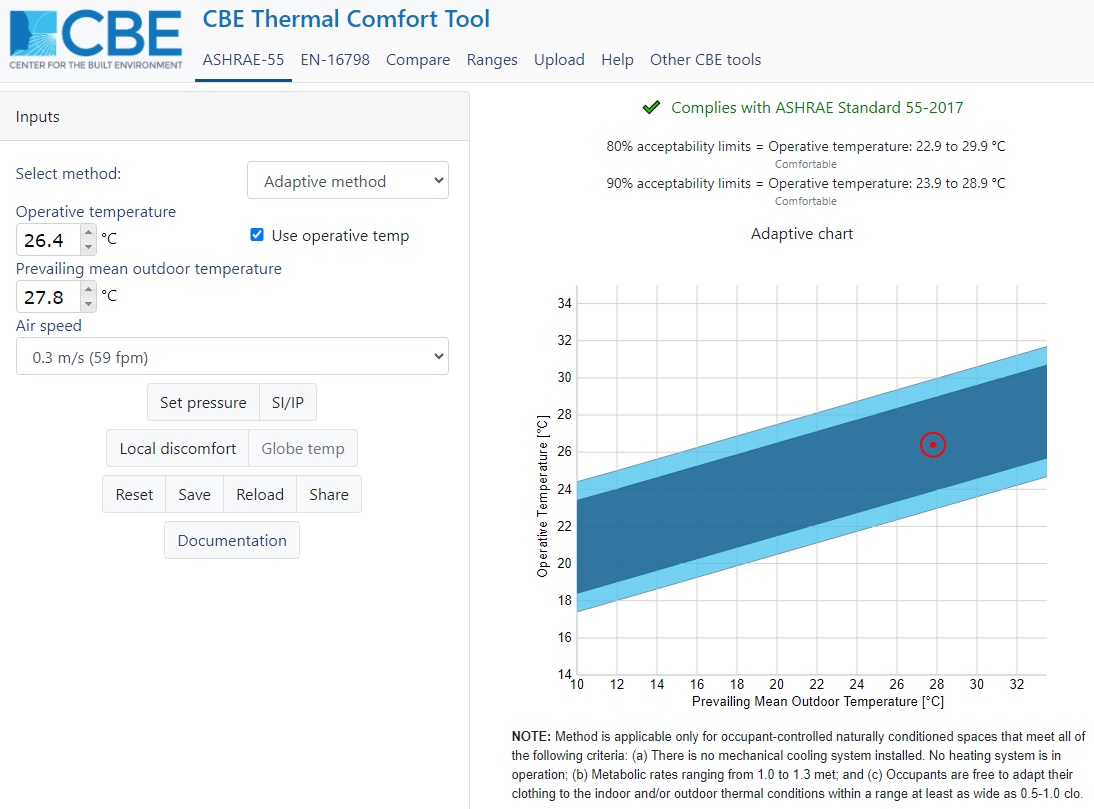
For the standard, under the analytical model, the comfort range is between -0.5 < PMV < +0.5 and PPD < 10 % (Standard, 2017). Para hallar la sensación térmica, el PMV y PPD, los datos de ingreso son: temperatura ambiente (Ta); mean radiant temperature (T mr) (°C); Air speed (V) (m/s); relative humidity (RH) ( %); met and clo, (Figure 5). For acceptability under the adaptive model, the operating temperature (To) and the average outdoor ambient temperature (Tpma (ext)) are entered (Figures 5 and 6).
Results
Environmental Audit of User Perception–APPU
The results of the objective component of the AAPU outside the classrooms revealed an average ambient temperature (Ta) of 25.3 °C, with a maximum of 32.3 °C and a minimum of 23.1 °C, whereas the average relative humidity (RH) was 58 %, with a maximum RH of 61 % and a minimum of 39.4 %, according to the warm dry climate defined by the Institute of Hydrology, Meteorology and Environmental Studies (IDEAM), for the city of Cali.
The climatic parameters measured outdoors in each of the schools during the dry month yielded an average temperature between 25.8 °C, with a maximum of 40.4 °C and a minimum of 18 °C. In the rainy month, the average temperature was 24.5 °C, with a maximum of 32 °C and a minimum of 19 °C. Regarding the results of the To inside the classrooms, the values were 25 °C and 26.2 °C for the dry and rainy months for the classrooms on the ground floor, with values close to 27.2 °C and 26.6 °C for tall plants, respectively, in the rainy and dry months, indicating that there were no monthly thermal differences.
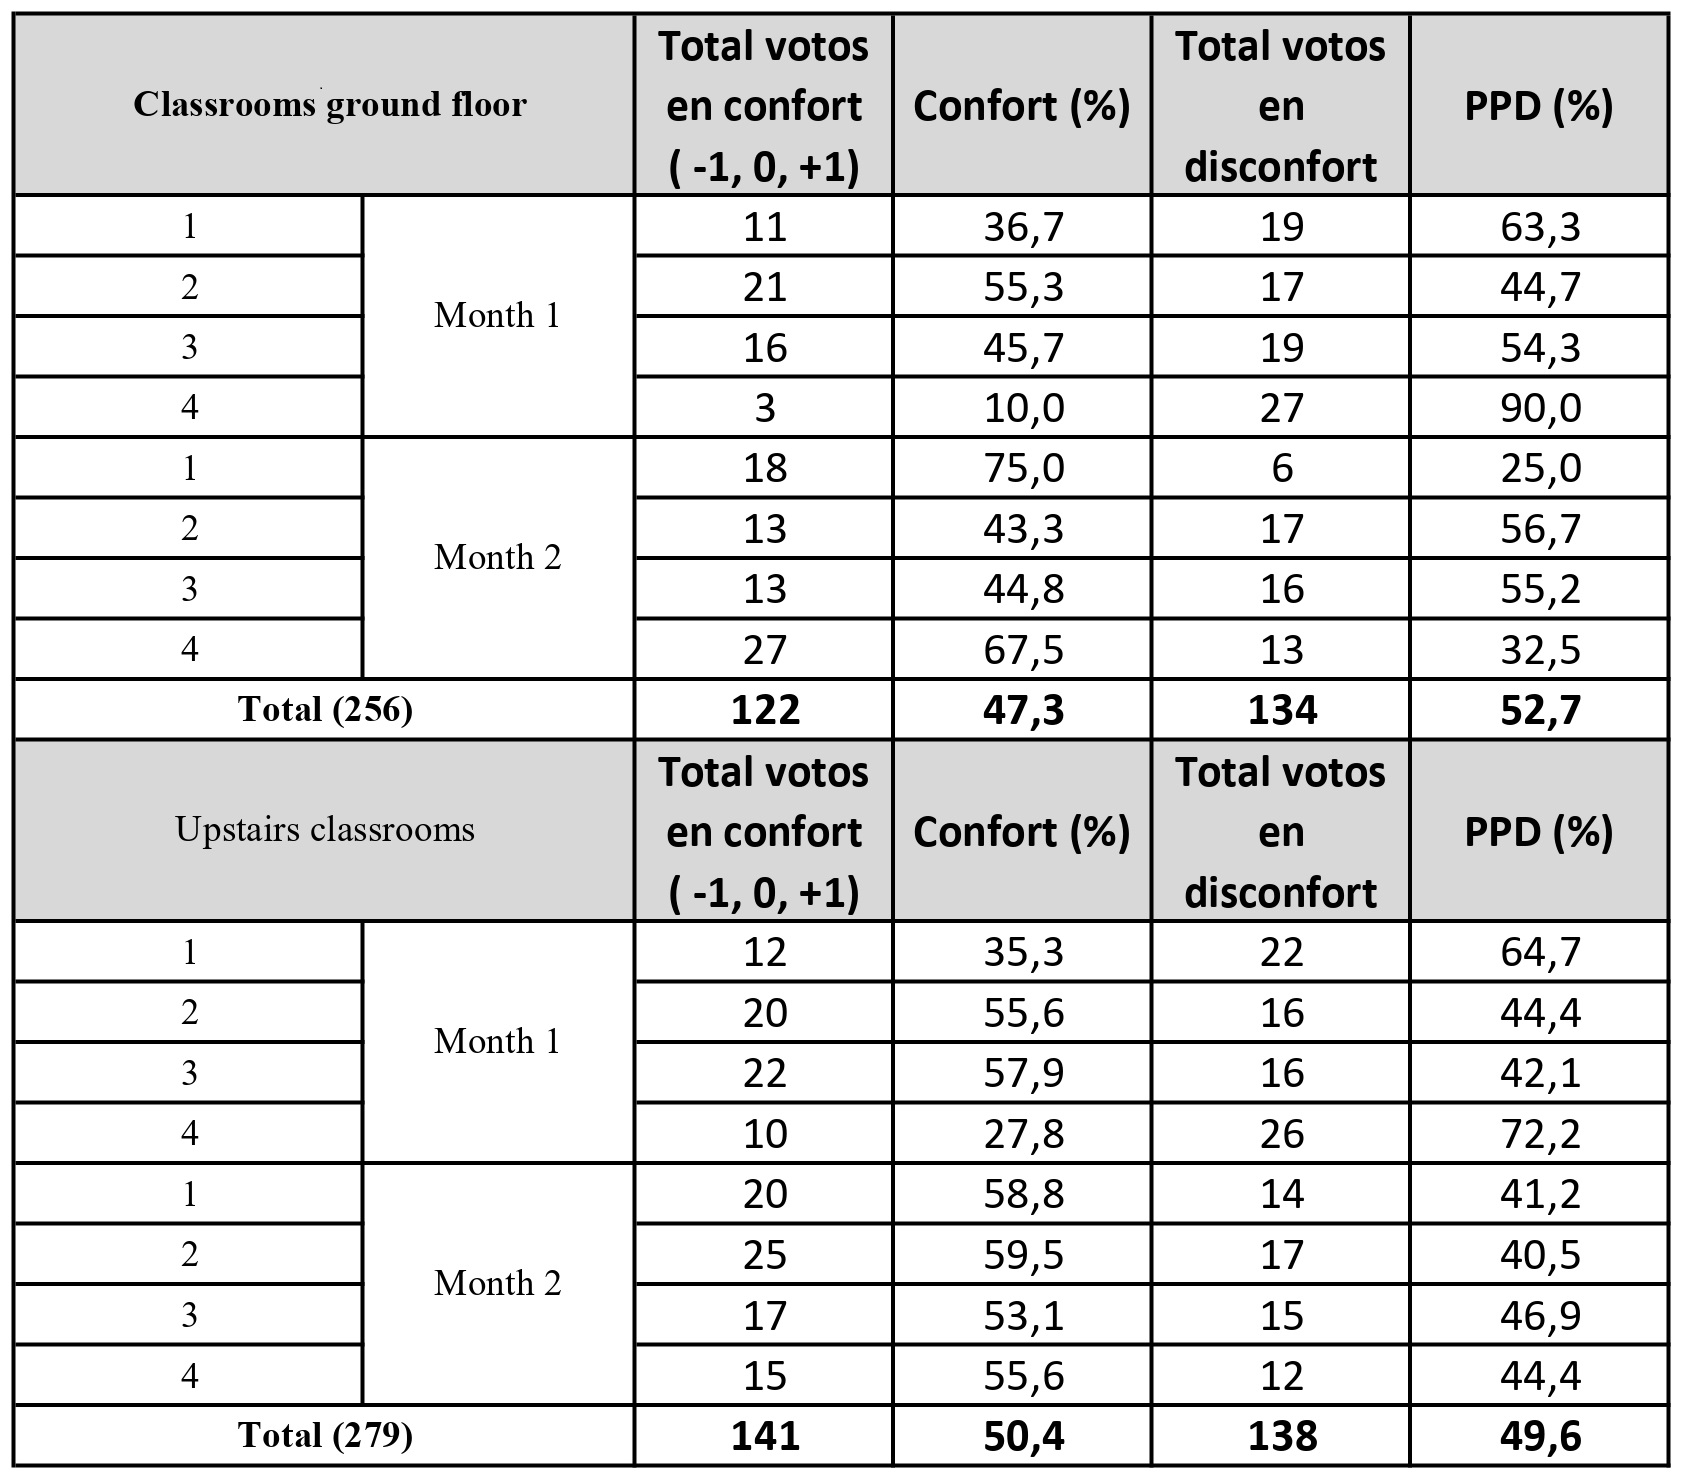
On the other hand, the subjective component of the AAPU corresponds to 256 VSTs of the classrooms on the ground floor (47.8 %), whereas the classrooms located on the upper floor with 279 VSTs represent 52 %, with a stable sample. The distribution of the votes on the scale of thermal sensation was similar for the three central votes (or comfort) 122 and 141 on the ground floor and high, respectively; for example, the votes on the ground floor and the ground floor were positive for discomfort due to colds 84 and 88 and heat discomfort 50 both on the ground floor and on the top floor, as shown in Table 3 and Table 4, respectively.
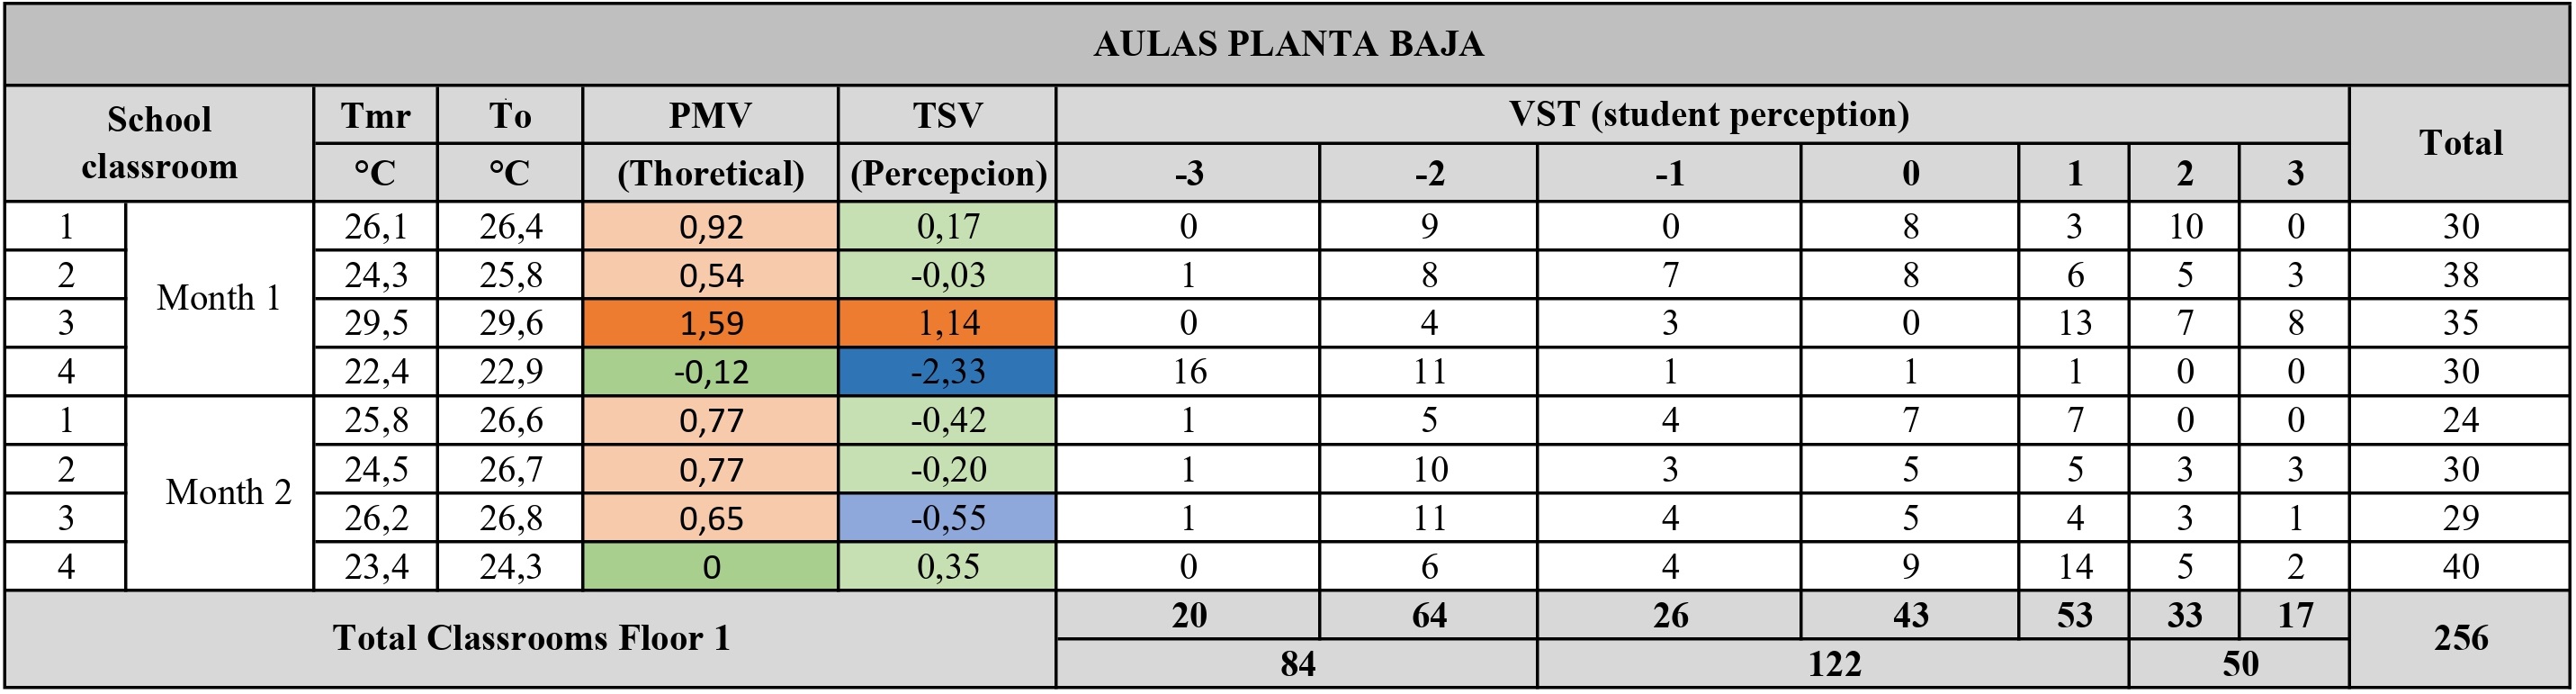
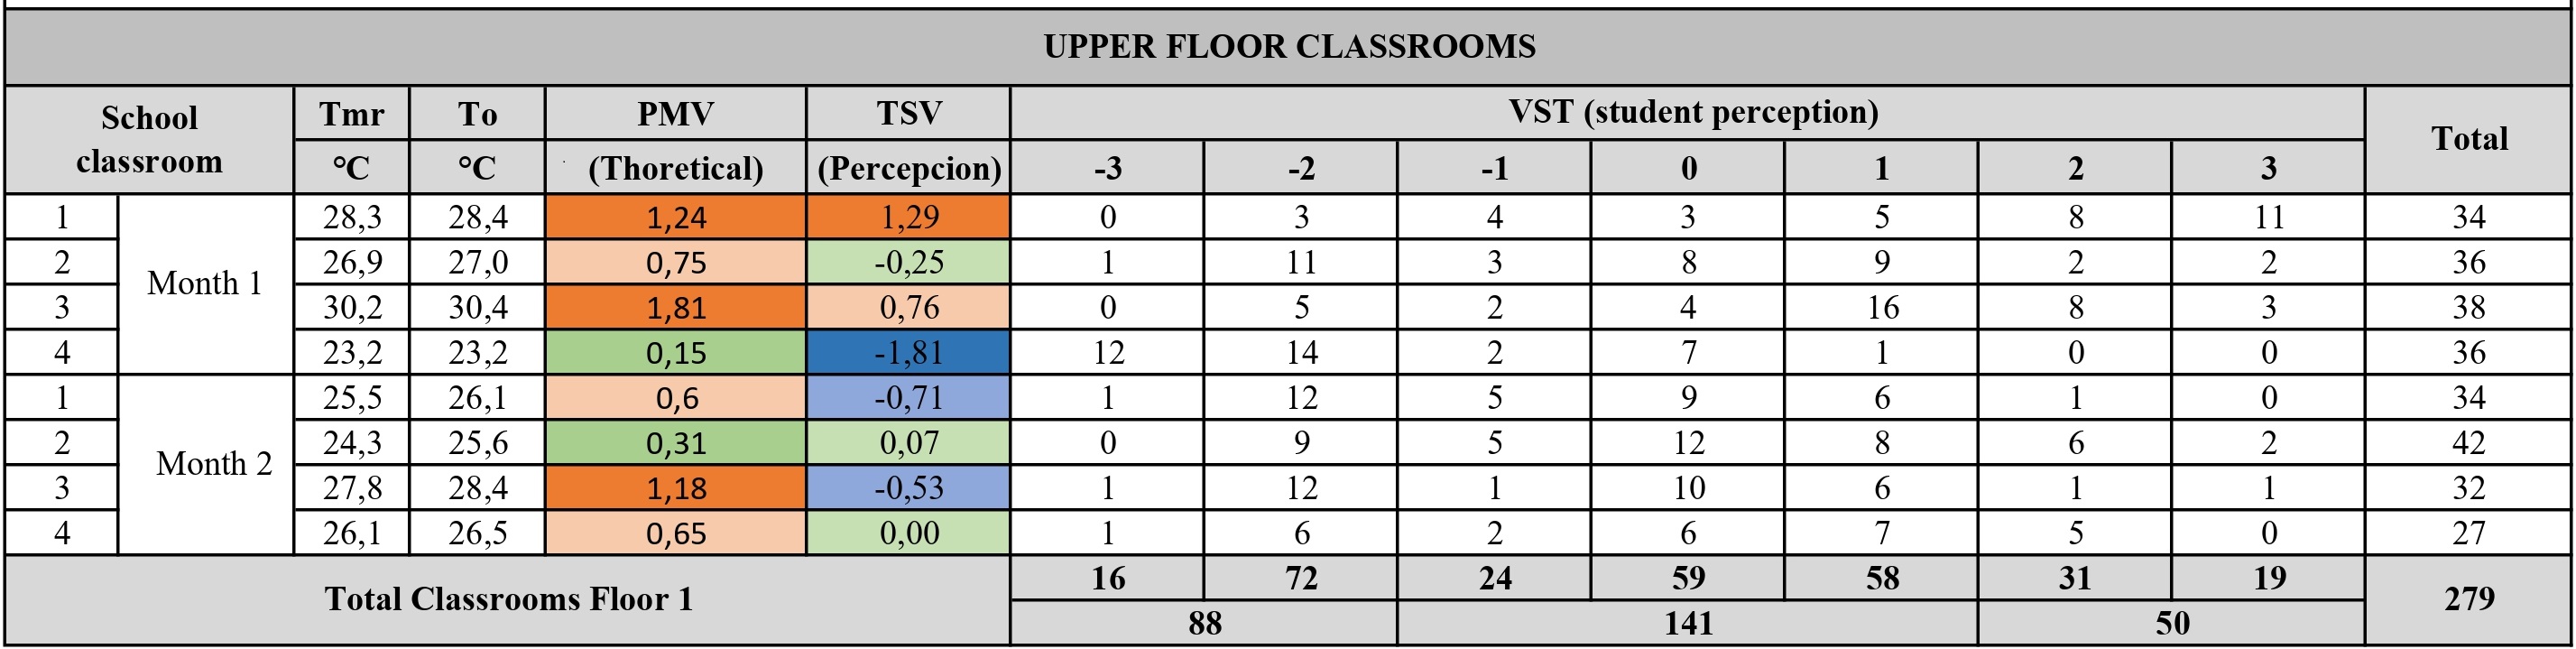
Thermal Comfort under the Analytical Model
The results of the PMV under the theoretical model predict a warmer thermal sensation than that reported in the study. As shown in Tables 3 and 4 and in Figure 7, under the theoretical PMV, the majority of the classrooms would be left with sensations between slightly cool to warm (from -0.5 to 2.0), whereas the Thermal Sensation-VST Votes of the students were dispersed in the thermal scale with votes between cool to slightly warm (-2.5 to 1.5) (Figure 7).
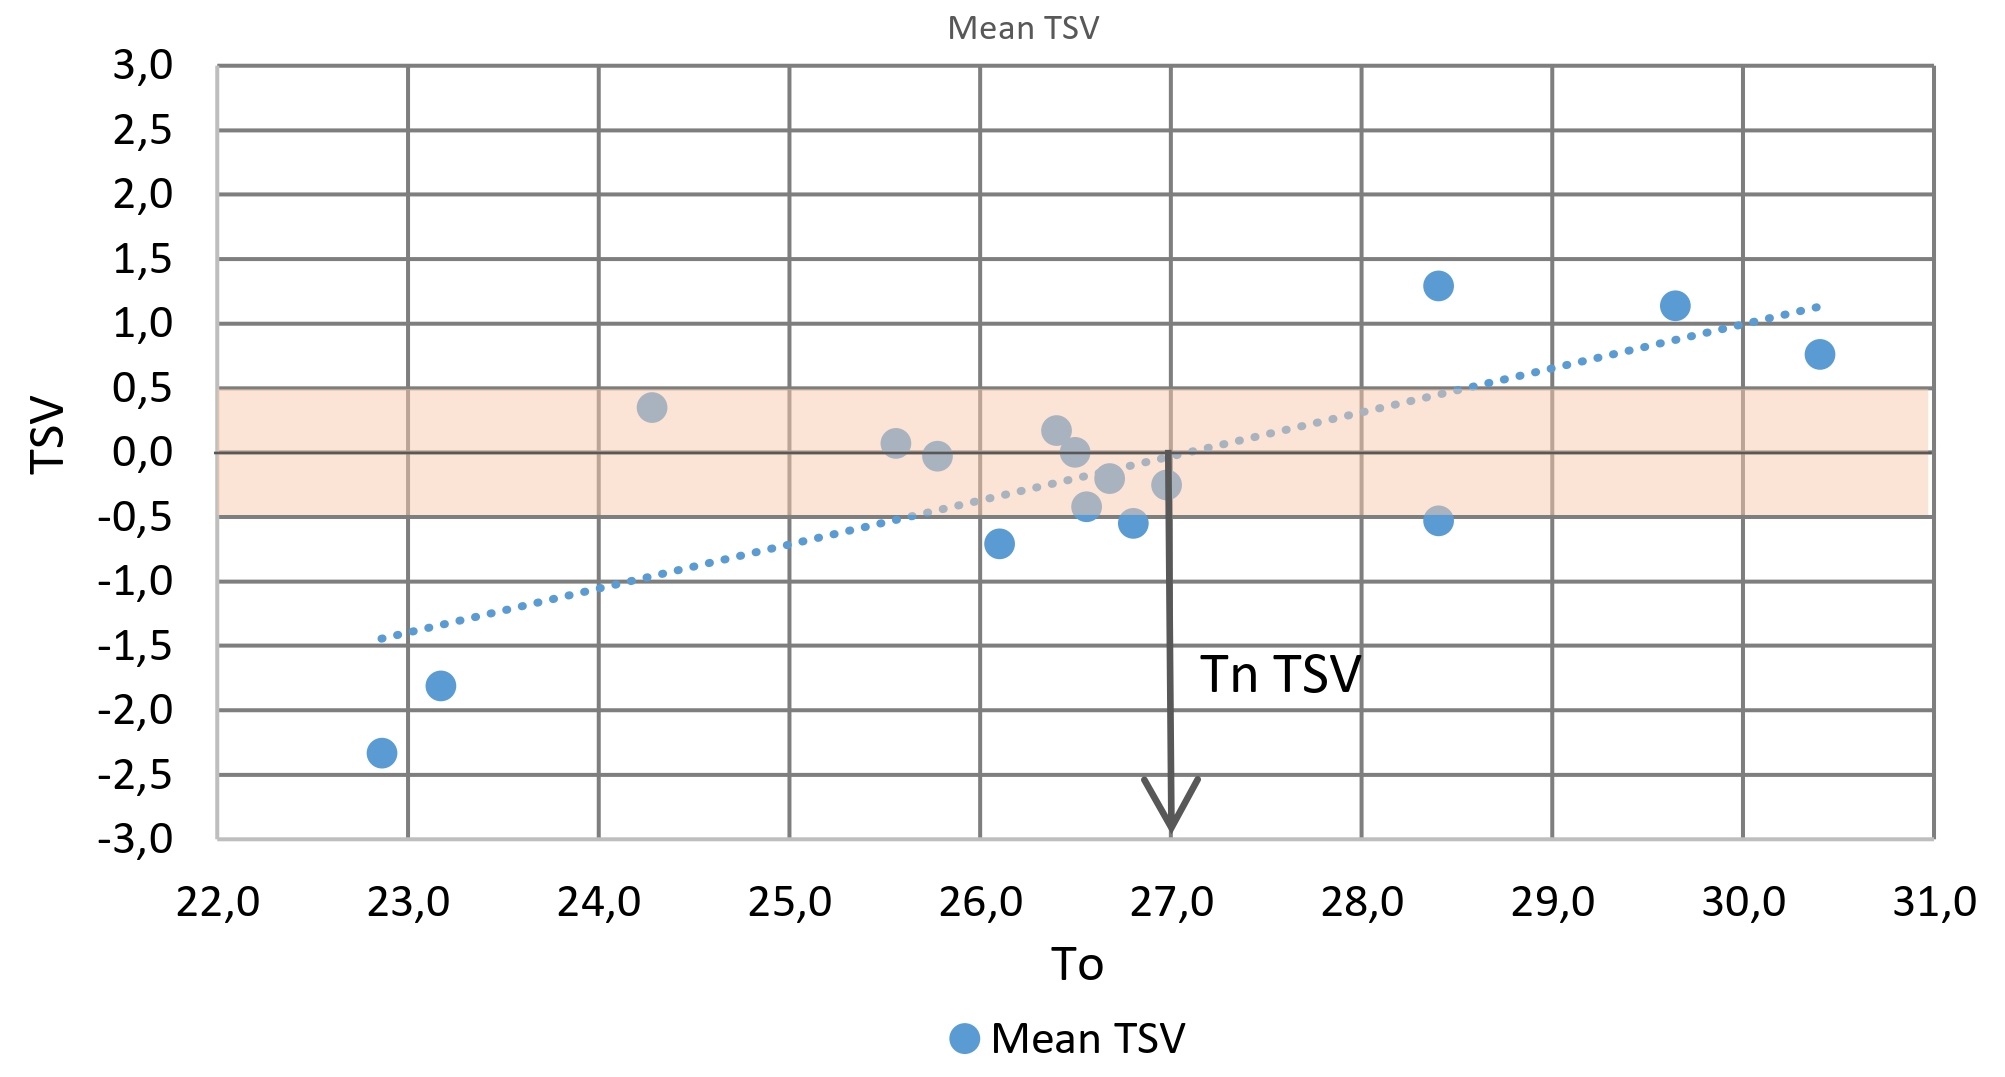
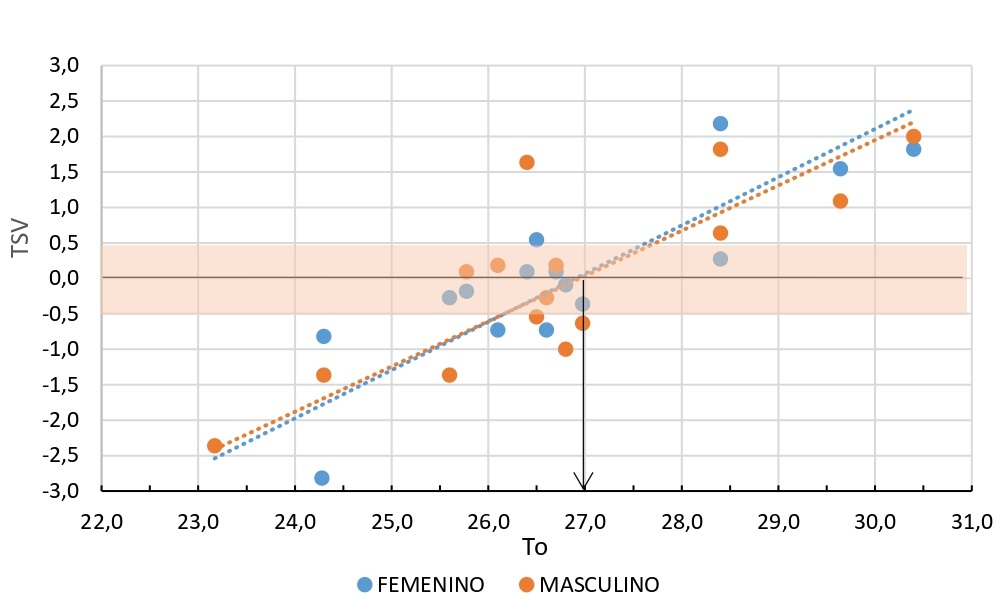
The neutral temperature (Tn) under the theoretical model (PMV and To) is 23.5 °C, whereas the Tn product of the surveys (VST and To) is 27 °C (Figure 8), implying a difference of 3.5 °C. This value coincides with the Tn reported by 11-year-old children in classrooms in Costa Rica [31], a situation that reinforces the findings of other studies in schools where a warmer thermal sensation was recorded than that reported in the regulations.

The analysis under the PMV is more sensitive to environmental situations at the different levels where the classrooms are located than to personal conditions manifested by students, such as gender. The Tn among the classrooms located on the ground floor (Tn = 26.6 °C) is consistent with other findings in laboratories with a similar climate, such as that of India, where they reported 26.6 °C [32], and in classrooms in Nigeria, which reported 26.8 °C [33].
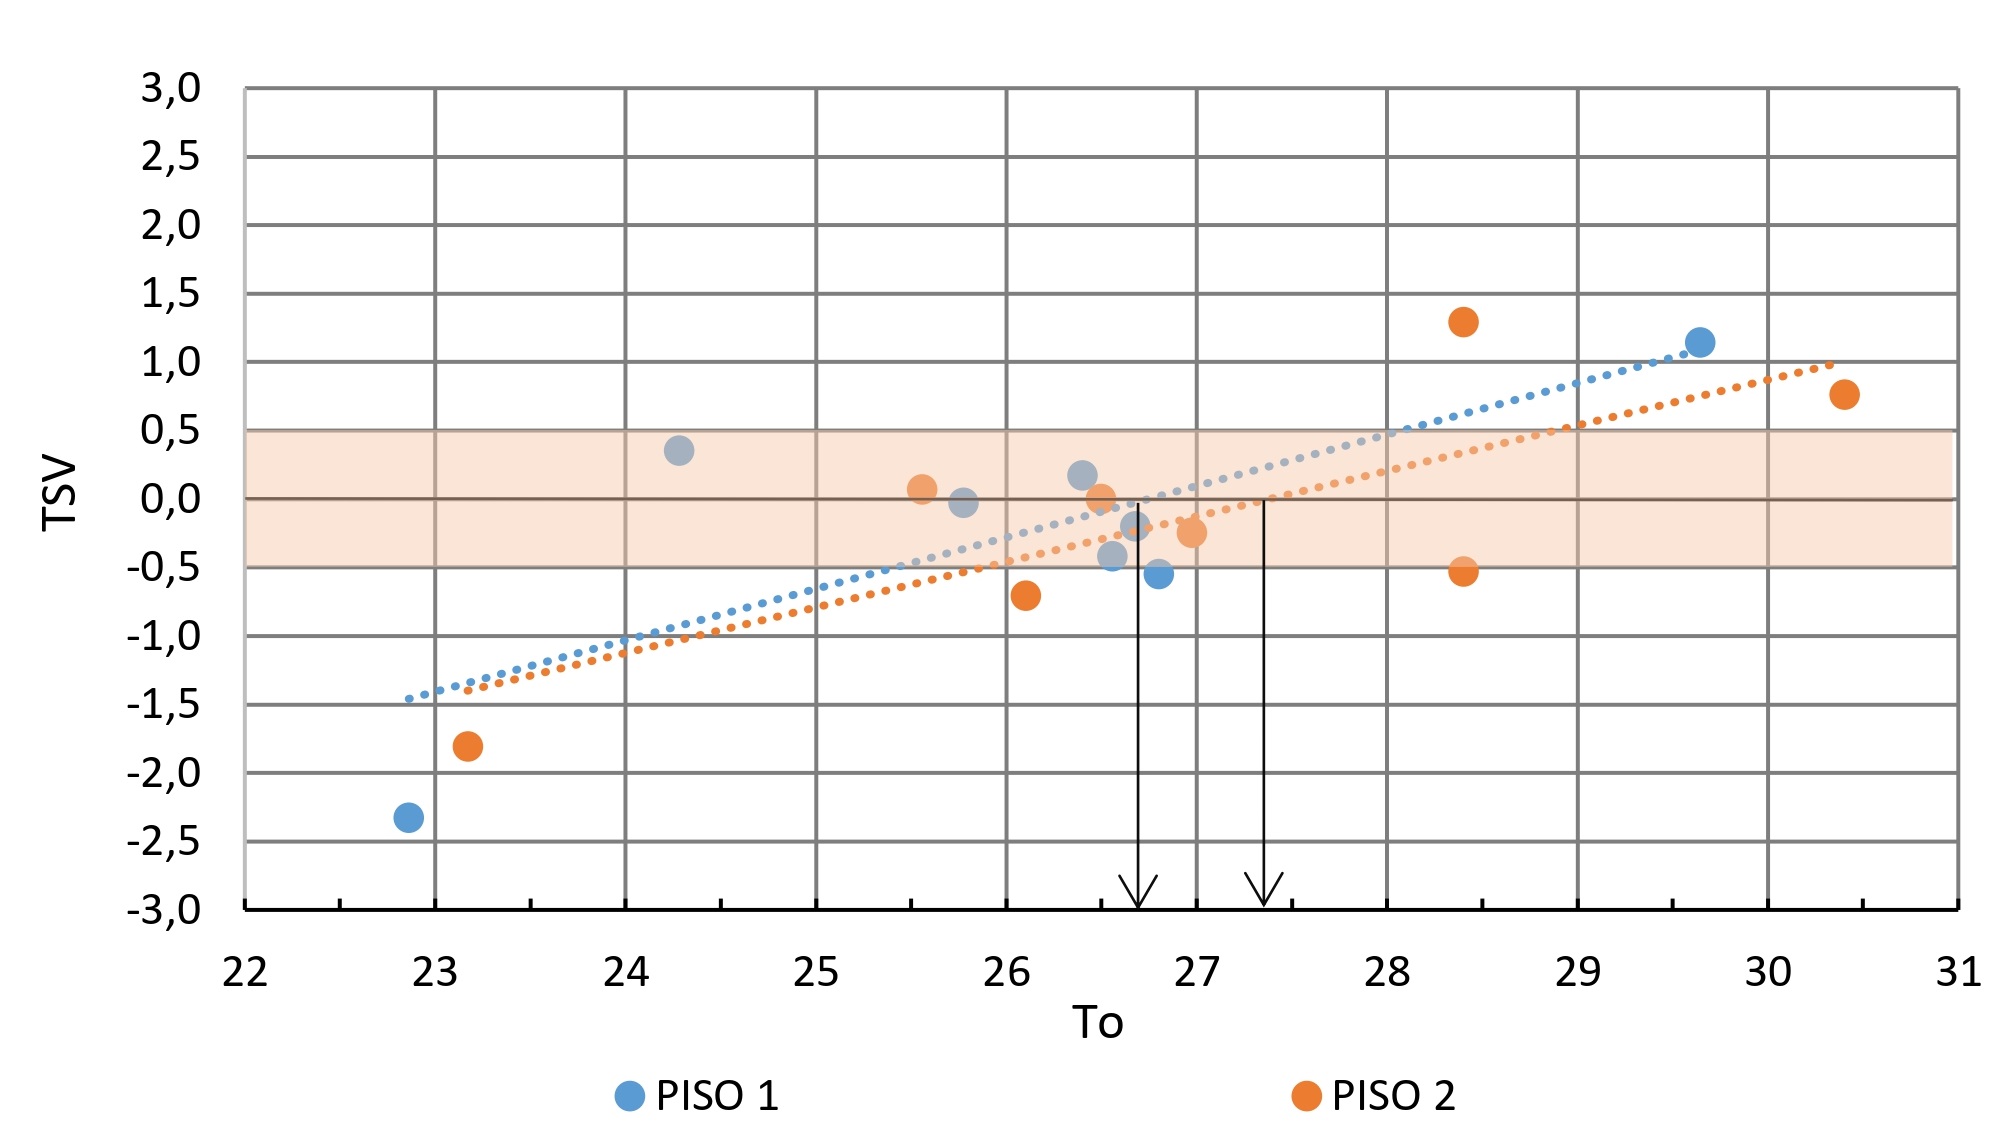
The Tn = 26.5 °C found on the ground floor is slightly lower than that reported for tall plants (Tn = 27.5 °C), as indicated by Figure 9, which coincides with the Tn = 27.5 °C reported in classrooms in Hawaii [24] and Japan [34]. While the Tn discriminated according to sex is 27 °C (Figure 10) without presenting any variation, a situation contrary to the findings of studies where the Tn of girls and boys between 11 and 17 years of age presented a difference of 0.9 °C [25].
Thermal Comfort under the Adaptive Model
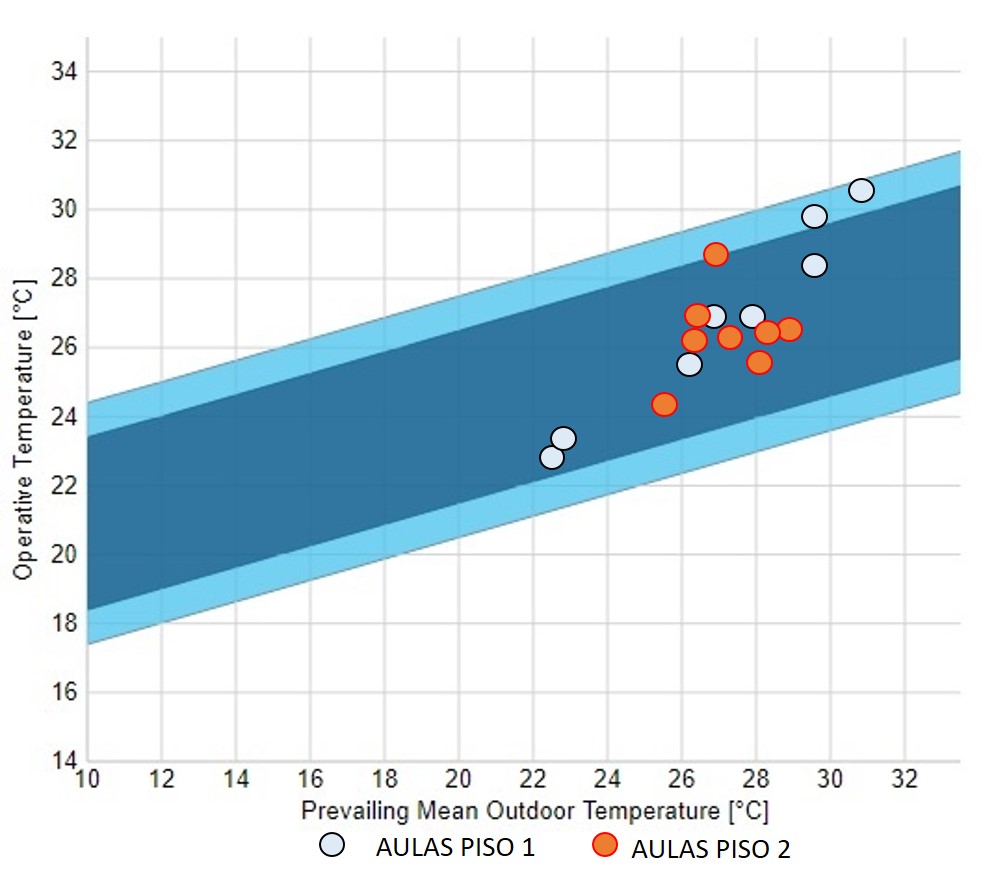
For the adaptive model, acceptability is assumed to be manifested in the percentage of votes in the three central categories (-1, 0, +1), that is, 47.7 % and 50.5 % in the classrooms of the lower and upper floors, respectively. Table 5, which is far from the acceptability of 80 % indicated by the range of the NTC 4595 standard [5] or that predicted by the theoretical model in an operating temperature range between 22.5 °C and 30.5 °C, as presented in Figure 11.
The results of this study contradict those of other studies carried out in temperate climates where high percentages of acceptability were reported at high temperatures, such as 90 % acceptability at 30 °C in Taiwan [35] and from 78 % to 30.7 °C in Tezpur, India [13].
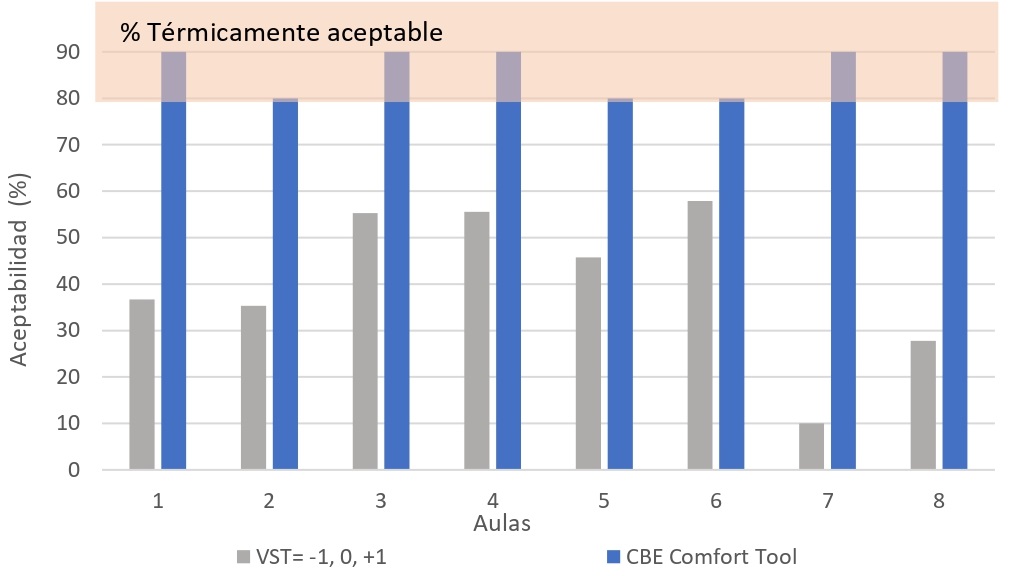
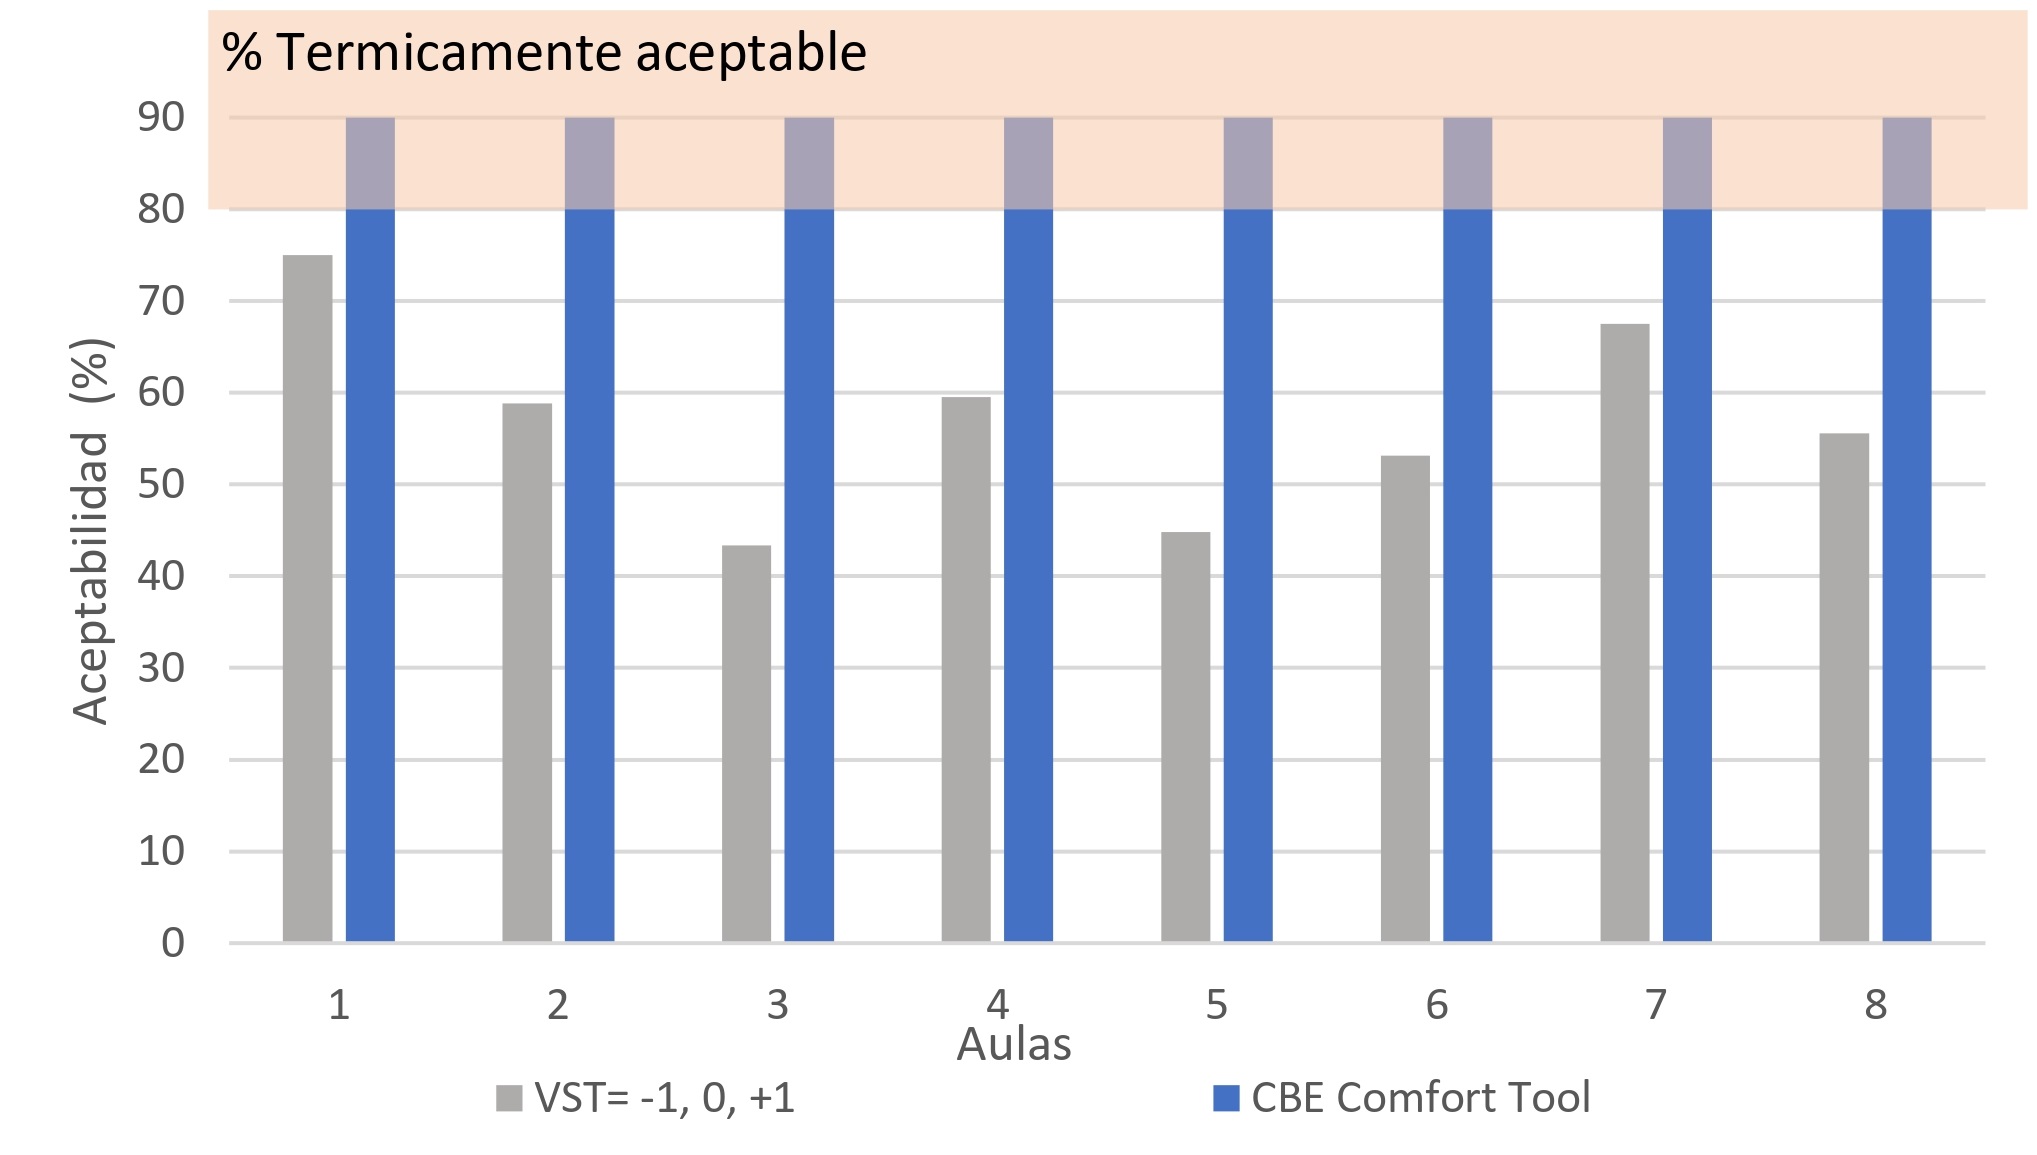
When the levels of acceptability determined by the TSV tool and the CBE Comfort tool are compared in Figure 12 and Figure 13, respectively, the results with the CBE Comfort Tool indicate that in all the classrooms, the acceptability is greater than 80 %. However, surveys reveal that only two classrooms (rooms 1 and 7 in the dry period) are close to 70 %, and the remaining classrooms are less than 60 % acceptability.
Moreover, the percentages of acceptability are greater in the rainy season than in the dry season. This same situation was reported by Yaoundé in Africa, which has a cold and humid tropical climate [36], confirming that in places with high ambient temperatures, the level of accustomation plays a relevant role.
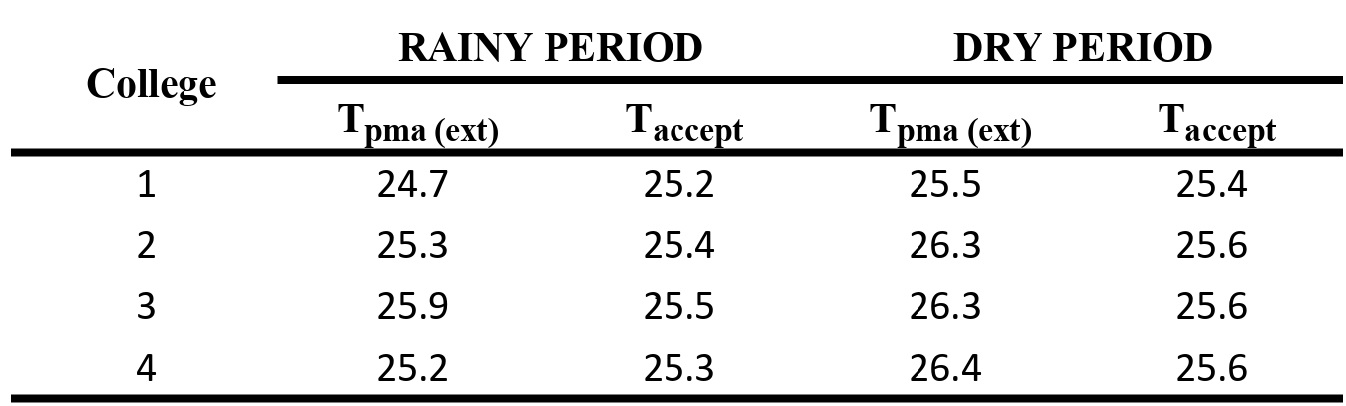
The average operating comfort temperature Taccepted (after Equation 3) is similar, with averages of 25.3 °C and 25.5 °C for the rainy and dry periods, respectively (Table 6), which does not coincide with the Tn = 27 °C result of the surveys. This finding is consistent with the results in Taiwan [12], where the theoretical model was up to 2.3 °C lower.
Conclusions
The two theoretical models used for the analysis of thermal comfort are not very accurate when evaluating comfort.
In naturally ventilated classrooms such as the ones studied here, the students manifested a Tn up to 3.5 °C higher than that predicted by the analytical model, which, in addition, predicted a predicted average vote of heat discomfort, not coinciding with the registered one in the studio. The PMV was more thermally demanding, which indicates that, in the study context, the students tolerate higher temperatures; therefore, generating predictions with this model can lead to oversizing the thermal design of the spaces and increasing energy consumption and environmental pollution.
On the other hand, the students reported an acceptability close to 50 % in the range of 22.5 °C. ≤ To ≤ 30.5 °C, much lower than the 80 % acceptability predicted by the adaptive model, under the same conditions. Under the theoretical model, the comfort situation would be acceptable to the majority, which would imply that it is not necessary to resort to an architectural design that considers particular specifications in relation to its location and climate.
The analysis methodology used from the application of an environmental audit that considers objective and subjective components and compares the results with the regulations and theoretical methods to determine thermal comfort yields relevant information, both for the adjustment of local regulations, of the implemented models and the evaluation of the building responses, for warm conditions.
Consequently, it is necessary to develop more studies to advance knowledge and build standards that contribute to the regional adaptation of international norms and that closely reflect reality.
References
[1] Instituto Colombiano de Normas Técnicas y certificación (ICONTEC), “Norma Técnica Colombiana NTC 5316,” Thermal environmental conditions for human occupancy. p. 34, 2004.
[2] ANSI/ASHRAE Standard 55-, “Thermal Environmental Conditions for Human Occupancy.” 2017.
[3] P. O. Fanger, Thermal comfort. Analysis and applications in environmental engineering. 1972.
[4] Instituto Colombiano de Normas Técnicas y Certificación (ICONTEC), “Norma Técnica Colombiana 4595: Ingeniería Civil y Arquitectura Planeamiento y Diseño de Instalaciones y Ambientes Escolares,” Bogotá, 2000.
[5] Instituto Colombiano de Normas Técnicas y certificación (ICONTEC), Norma Técnica Colombiana NTC 4595. Planeamiento y diseño de instalaciones y ambientes escolares. Colombia, 2020, p. 81.
[6] M. A. Humphreys, “An adaptive approach to the thermal comfort of office workers in North West Pakistan,” Renew. Energy, vol. 5, no. 5–8, pp. 985–992, Aug. 1994.
[7] N. A. Oseland, “PredicOseland, N. A. (1995). Predicted and reported thermal sensation in climate chambers, offices and homes. Energy and Buildings, 23(2), 105–115. https://doi.org/10.1016/0378-7788(95)00934-5ted and reported thermal sensation in climate chambers, offices,” Energy Build., vol. 23, no. 2, pp. 105–115, Dec. 1995.
[8] J. Matthews and F. Nicol, “23 Thermal Comfort of Factory Workers in Northern India,” Stand. Therm. Comf. Indoor Air Temp. Stand. 21st Century, p. 227, 1995.
[9] R. J. de Dear and G. S. Brager, “Developing an adaptive model of thermal comfort and preference,” ASHRAE Trans., vol. 104, pp. 1–18, 1998.
[10] A. Tablada, A. M. De La Peña, and F. De Troyer, “Thermal comfort of naturally ventilated buildings in warm-humid climates: field survey,” in 22 Conference on Passive and Low Energy Architecture, 2005, pp. 1–6.
[11] A. G. Kwok, “Thermal comfort in naturally-ventilated and air-conditioned classrooms in the tropics.,” Universidad de California, 1997.
[12] H. H. Liang, T. P. Lin, and R. L. Hwang, “Linking occupants’ thermal perception and building thermal performance in naturally ventilated school buildings,” Appl. Energy, vol. 94, pp. 355–363, 2012.
[13] P. Baruah, M. Kumar Singh, and S. Mahapatra, “Thermal Comfort in Naturally Ventilated Classrooms,” PLEA 2014 - 30th Int. Plea Conf., no. December, pp. 1–8, 2014.
[14] R. L. Hwang, T. P. Lin, C. P. Chen, and N. J. Kuo, “Investigating the adaptive model of thermal comfort for naturally ventilated school buildings in Taiwan,” Int. J. Biometeorol., 2009.
[15] S. P. Corgnati et al., “Thermal comfort in educational buildings: A review article,” Renew. Sustain. Energy Rev., vol. 59, no. 2, p. 11, 2016.
[16] M. K. Nematchoua, R. Tchinda, and J. A. Orosa, “Adaptation and comparative study of thermal comfort in naturally ventilated classrooms and buildings in the wet tropical zones,” Energy Build., vol. 85, pp. 321–328, 2014.
[17] V. Iglesias, C. A. Herrera, and M. E. Rosillo, Confort ambiental en escuelas públicas de Cali. Universidad del Valle, 2016.
[18] C. M. Zapata et al., Comodidad ambiental en aulas escolares. Incidencia en la salud docente y en el rendimiento cognitivo de los estudiantes en colegios públicos de Bogotá, Medellín y Cali, 1st ed. Editorial Bonaventuriana; Ediciones Unisalle; Universidad Nacional de la Plata, 2018.
[19] G. A. San Juan and S. Hoses, “Auditoría ambiental de percepción del usuario (aapu). Manual Operativo y Sistema de gestión,” in Aprendizaje en las escuelas del siglo XXI, Banco Interamericano de Desarrollo-BID, Ed. 2012.
[20] G. A. San Juan, S. Hoses, D. Rojas, and J. M. Moreno, “Integración de la opinión de los usuarios en la evaluación ambiental de aulas escolares,” Av. en energías Renov. y medio Ambient., vol. 3, no. 1, pp. 169–172, 1999.
[21] G. A. San Juan, S. Hoses, and I. Martini, “Auditoría ambiental y condiciones de confort en establecimientos escolares,” in Aprendizaje en las escuelas del siglo XXI, Banco Interamericano de Desarrollo-BID, Ed. 2014, p. 80.
[22] G. A. San Juan and S. Hoses, “Sistema de Procesamiento de Auditoría, Objetiva + Subjetiva [SISPA O+S],” in Aprendizaje en las escuelas del siglo XXI., 1st ed., Banco Interamericano de Desarrollo-BID, Ed. 2013.
[23] F. J. Forbes, “Diseño de una aplicación computacional para el calculo de factor de vision y TMR en espacios arquitecónicos,” Universidad Del Valle, 2017.
[24] A. G. Kwok and C. Chun, “Thermal comfort in Japanese schools,” Sol. Energy, vol. 74, no. 3, pp. 245–252, 2003.
[25] K. Al-Rashidi, D. Loveday, and N. Al-Mutawa, “Investigating the applicability of different thermal comfort models in Kuwait classrooms operated in hybrid air-conditioning mode,” Sustain. energy …, pp. 347–355, 2009.
[26] F. Nicol, M. Humphreys, and S. Roaf, Adaptive thermal comfort: principles and practice. Routledge, 2012.
[27] T. Hoyt, S. Schiavon, A. Piccioli, T. Cheung, D. Moon, and K. Steinfeld, “CBE Thermal Comfort Tool,” Center for the Built Environment, University of California Berkeley, 2017. [Online]. Available: http://comfort.cbe.berkeley.edu/.
[28] ASHRAE/ANSI, Standard 55-2013:User´s manual: thermal environmental conditions for human occupancy. ASHRAE, 2013.
[29] S. Subhashini and K. Thirumaran, “A passive design solution to enhance thermal comfort in an educational building in the warm humid climatic zone of Madurai,” J. Build. Eng., vol. 18, pp. 395–407, Jul. 2018.
[30] B. G. Rodrigo, J. C. Sanabria, M. Marchamalo, and M. Umana, “Análisis del confort y el comportamiento higrotérmico de sistemas constructivos tradicionales y actuales en viviendas de Santa Ana-Ciudad Colón (Costa Rica),” Inf. la Construcción, vol. 64, no. 525, pp. 75–84, 2012.
[31] J. A. Porras-Salazar, D. P. Wyon, B. Piderit-Moreno, S. Contreras-Espinoza, and P. Wargocki, “Reducing classroom temperature in a tropical climate improved the thermal comfort and the performance of elementary school pupils,” Indoor Air, 2018.
[32] A. K. Mishra and M. Ramgopal, “Thermal comfort in undergraduate laboratories - A field study in Kharagpur, India,” Build. Environ., vol. 71, pp. 223–232, 2014.
[33] A. C. Ogbonna and D. J. Harris, “Thermal comfort in sub-Saharan Africa: Field study report in Jos-Nigeria,” Appl. Energy, vol. 85, no. 1, pp. 1–11, 2008.
[34] A. Kwok, “Indoor Environmental Quality (IEQ) Title Thermal comfort in naturally-ventilated and air-conditioned classrooms in the tropics,” 1997.
[35] R.-L. Hwang, T.-P. Lin, C.-P. Chen, and N.-J. Kuo, “Investigating the adaptive model of thermal comfort for naturally ventilated school buildings in Taiwan,” Int. J. Biometeorol., vol. 53, no. 2, pp. 189–200, 2009.
[36] M. K. Nematchoua, R. Tchinda, and J. A. Orosa, “Adaptation and comparative study of thermal comfort in naturally ventilated classrooms and buildings in the wet tropical zones,” Energy Build., vol. 85, pp. 321–328, 2014.
Notes
*
Research article
Author notes
aCorrespondence author. E-mail: olgaluciamontoyaflorez1972@gmail.com
Additional information
How to cite this article: C. Herrera, G.
San Juan, O. L. Montoya, “Comparative Study of Analytical and Adaptive
Thermal Comfort Models in Tropical Classrooms” Ing. Univ. vol. 28, 2024. https://doi.org/10.11144/Javeriana.iued28.csaa
