Introduction
The looming energy crisis, rising demand, and limited energy sources have attracted the attention of scientists and business leaders [1]. The uncertainty associated with future energy prices is alarming [2], making its efficient use an imperative to improve the competitiveness and profitability of process industries [3].
Second-generation (2G) bioethanol production from lignocellulosic wastes, which are energy-intensive and have low yields, has found an economically promising solution in bioethanol biorefineries [4]. Biomasses such as corn stover, wheat straw, switchgrass, and eucalyptus residues were evaluated, but advanced technology and process integration are required [5, 6]
At present, the sugar industry intends to gradually increase sugar production and advance in the creation and exploitation of derivative and by-product plants. In this strategy, special attention is also given to the efficient management of water and energy in these processes, as these resources are being depleted more and more every day [2]. Sugar industry wastes present a challenge to sugar mills as their final disposal leads to environmental and health problems, such as the presence of pests, bad odors, and the generation of greenhouse gases. For this reason, the industry is seeking solutions to convert its waste into by-products that can provide technical and economic benefits, while simultaneously reducing environmental impact [7].
In recent years, significant design techniques have been developed and applied in the chemical process industry to minimize mass and energy consumption through process integration. Energy integration has been incorporated into research that seeks the feasibility of second-generation bioethanol production using agroforestry residual biomass, namely eucalyptus residues and corn stover, obtaining positive results in reducing auxiliary service and production costs. [4]
The application of these techniques constitutes a solution to the challenges currently faced by the sugar industry. Process integration has resulted in considerable improvements in process efficiency, both technologically, economically, and environmentally. This tool is based on the use of intermediate process streams; in the case of material integration, to minimize the residual flow to be treated, and in the case of energy integration, to reduce the consumption of auxiliary services [1].
The energy integration of processes is based on the first and second laws of thermodynamics and represents a fundamental stage in the design of a new plant or in the optimization of an existing one, emphasizing the efficient use of energy and the reduction of negative environmental impacts. Energy integration is achieved by increasing the efficiency of the system under study by maximizing the use of recovered energy and minimizing the use of energy carriers, using one of its two fundamental tools: Pinch Analysis (PA) and Mathematical Programming (MP) [8].
Pinch technology represents a simple methodology to systematically analyze chemical processes and their surrounding utility systems. This term was introduced by Linnhoff in 1977. It is based on thermodynamic methods to determine the minimum external energy necessary for the design of heat exchanger networks. Using this methodology, it is possible to achieve cost savings by better integrating heat transfer processes, maximizing heat recovery from process to process, and reducing external loads of auxiliary (thermal) services. In addition, energy costs are identified, the cost of the heat exchanger network is estimated, and the pinch point is determined. This analysis assumes that heat transfer will occur until a temperature difference between the streams equals the minimum temperature difference recommended for each type of process. Pinch technology is one of the most practical process integration tools of the last 20 years. It has been successfully applied in various industries such as petrochemical, food, paper, and others. The application of this technique improves the engineering design of the process and facilitates the optimization of the total energy consumption [8].
The Pinch point is the critical point, where any thermal exchange between the streams passing through it leads to additional consumption of hot and cold auxiliary services, violating the minimum expected consumption of auxiliary services. Therefore, the Pinch point divides the analysis into two thermally independent parts, as there is no heat flow through it, forming a region above the Pinch point (exchanges heat with heating streams) and below the Pinch point (exchanges heat with cooling streams) [7].
Aspen Energy Analyzer is an energy simulation tool used to model and analyze complex energy systems. It is designed to analyze and improve the performance of heat exchanger networks (HENs). Aspen Energy Analyzer’s focus is on network analysis from an operations and design perspective. HEN operation functions are designed to provide the user with an understanding of current plant operation and related issues, such as contamination. In addition, fouling mitigation strategies can be studied and simulated in the software. The designer can use Aspen Energy Analyzer to identify and compare options to improve performance and reduce the gap between current and optimal thermodynamic operation. One of the most outstanding features of Aspen Energy Analyzer is its ability to design and analyze systems in real time. It also allows sensitivity analysis to identify key factors affecting system performance [10, 11].
There are numerous research studies related to the application of the Pinch tool to improve efficiency in the alcohol industry due to high auxiliary service consumption in the processes. To improve the efficiency of the bioethanol and succinic acid production process from bread waste, Hafyan and coworkers [12] applied the Pinch tool for the optimal design of the heat exchange networks of one of the four proposed alternatives. This consisted of an energetically optimized integration of the fermentation of bread waste into bioethanol, together with the cogeneration of heat and electricity from stillage, achieving a reduction in heating and cooling consumptions.
Sanchez [13] carried out research with the objective of energetic integration and design of heat exchangers for an industrial plant producing 100 t/h of methanol by the Lurgi process. As a result, it was obtained that the energy costs of the plant after integration are 7,725,140 $/year, which represents a reduction of 6,932,859 $/year of the initial energy consumption of the plant. Despite the high initial investment, the payback period is 29 months.
Alio and coworkers [14] proposed the design of an integrated biorefinery plant to convert various forest wastes, such as sawdust, into bioethanol. For this purpose, they used several tools, including Pinch technology, aimed at reducing the consumption of auxiliary services. The hot and cold energy demands were reduced from 19.1 and 18.7 MW to 16.4 and 16.0 MW, respectively, which shows a low potential for energy recovery due to limitations inherent to the energy process. To solve the problem, they decided to use unreacted sugars and solids and fresh bark to generate the steam required for the process.
This article presents the results of a study of two cases of energy integration, carried out in the by-products plants of an agroindustrial company; one case represents the ethanol plant, and the other represents the combination of ethanol/CO. plants. The purpose of the study is to determine the savings generated by the application of Pinch technology in the industrial processes.
Materials and Methods
Several steps are followed for thermal integration, which in this research have been summarized taking into account the objectives of the study. These steps were extracted from [15]. Figures 1 and 2 are schematic representations of the process, indicating the main hot and cold streams considered in the analysis.
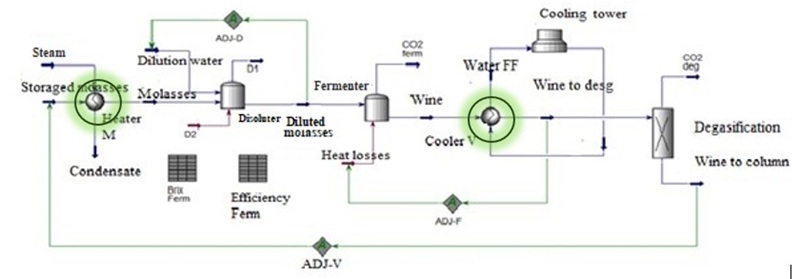 Figure 1.
Molasses fermentation stage
Figure 1.
Molasses fermentation stage
Source: Authors’ own creation.
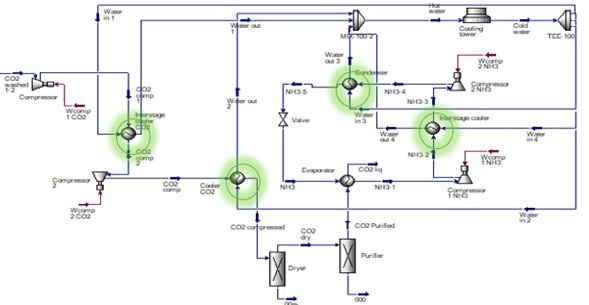 Figure 2.
CO2 plant
Figure 2.
CO2 plant
Source: Authors’ own creation.
Steps for the Energy Integration Analysis
-
1. Identification of hot,
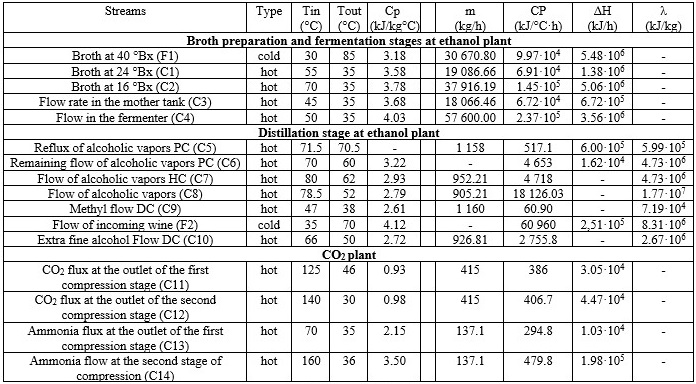
cold, and utility streams in the process (Table 1 lists the hot and cold
streams identified in the schemes under study).
Table 1.
Process data
Source: Authors’ own
creation.
The specific heat capacity values during the mash preparation and fermentation stages were calculated using Equation (1), which applies to sugar-containing streams [16].
Where: Cp: specific heat capacity (kJ/kg °C): °Bx: degrees Brix (percentage of dissolved solids in a liquid, in this case referring to the concentration of dissolved sugars)
The latent heat of condensation (λ) was determined based on literature data [17], taking into account the operating pressures of the equipment, the mass fraction of each component in the mixture, and the boiling temperature of the pure components.
In the ethanol production plant, 12 streams were identified, five corresponding to the broth preparation and fermentation stages (four hot and one cold), and six corresponding to the distillation stage (five hot and one cold).
In the CO2plant, four hot streams were identified, two belonging to the CO2 production process and two belonging to the ammonia refrigeration cycle.
2. Extraction of thermal data for the process streams and for general use.
From the flow diagram and the mass and energy balances [18, 19], for each identified stream, the following thermal data are extracted: Inlet temperature Te (°C): temperature at which the stream is available. Outlet temperature Ts (°C): temperature at which the stream is to be carried. Mass flow heat capacity CP (kJ/kg°C) is the product of the mass flow m (kg/h) and the specific heat Cp (kJ/ kg°C). Enthalpy change ΔH (kJ/h): associated with a stream passing through the heat exchanger. Latent heat of condensation λ, (kJ/kg).
Table 2 presents the heating and cooling demands for cases A and B in the current scheme.
Table 2.
Utility
demand

Source: Authors’ own
creation.
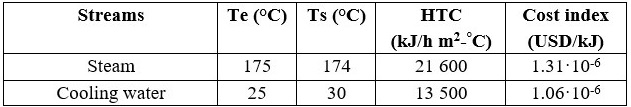
Table 3 shows the characteristics of the available auxiliary streams. Inlet temperature, outlet temperature, heat transfer coefficient (HTC), and cost index are shown.
Table 3.
Utility Streams
Source: Authors’ own
creation.
3. Estimation of the optimum ΔT
For this process, the study was started assuming a minimum value of ΔT=10 ºC. An optimal ΔTmin value was determined, for which the total costs become minimum. This value is determined by plotting the annualized total cost for different values of ΔTmin [20]. The Total Annualized Cost (TAC) is determined using equation (2) [21].
Where:
A: annualization factor (1/year)
CC: capital cost (USD)
OC: operating costs (USD/year)
The annualization factor represents the depreciation of the capital cost in the plant. It must be considered since capital costs and operating costs of a heat exchanger network do not share the same units of measurement [21].
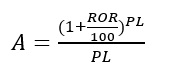
Equation 3 is used to calculate the annualization factor:
Where: ROR: rate of return (% of capital): PL: plant life in years.
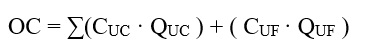
Operating costs associated with energy expenditures are determined using Equation 4. Required data can be obtained from the energy consumption reports registered in the plants.
Where: CUC: hot utility cost (USD/kJ); QUC: use of external hot utility services to the process (kJ/year); CUF: cold utility cost (USD/kJ); QUF: use of external cold utility services to the process (kJ/year).
Capital costs are determined using equation 5.
Where: a: Installation cost of a heat exchanger; b, c: established cost coefficients related to energy and heat exchanger area; S: number of shells; AHEN: Heat exchanger network area.
To gain a deep understanding of the thermodynamic, economic, and modeling assumptions underlying the calculations performed by the Aspen Energy Analyzer software, it is recommended to consult the technical literature associated with the program. This documentation provides the theoretical and methodological framework upon which the estimates of auxiliary service costs and criteria are built, allowing the user to assess the validity of the proposed configurations based on the specific conditions of the industrial process under study [21].
4. Determination of minimum energy requirements
Composite curves are the most commonly used tool to determine the minimum heating and cooling requirements for a network without having to specify the heat exchanger network. They make it possible to determine the minimum amount of heat or cold that needs to be supplied at any given temperature [15].
5. Synthesis of exchanger networks
At this stage of application of the Pinch methodology, there is a principle that must not be violated: a stream must never transfer heat through the Pinch temperature. Therefore, the process is divided into "above pinch" and "below pinch" to calculate the number of exchangers and design the exchange network [20] [21]. The grid diagram was used to generate new heat exchange network configurations, with subdivided streams up to three branches.
The energy integration steps described above are applied in this analysis using the Aspen Energy Analyzer computational tool.
Improvement alternatives
To maximize energy utilization from available resources and Aspen Energy Analyzer tools, three improvement alternatives were evaluated and applied to each case study.
Alternative 1: Integration of streams with energy potentials.
The possibilities for energy use of wasted hot streams [22], present in the distillation stage, were determined. In this alternative, the combination of the current streams with the selected stream with energy potentialities was used, so that the program generates heat exchange network designs that allow reducing energy consumption. If the currents are far apart, combinations should be evaluated with practical criteria. In this case, distances didn’t limit the integration. The data of the energetically available current are shown in Table 4.
Table 4.
Data on
energetically available streams
Source: Authors’ own creation.
Alternative 2: Retrofitting the heat exchange network.
This alternative, also called retrofit, is an automatic function of Aspen Energy Analyzer, which will use four methods: auxiliary service exchanger modification, heat exchanger resequencing, heat exchanger restructuring, and heat exchanger addition. The retrofit focuses on modifying an existing heat exchanger network to improve energy efficiency [23].
Alternative 3: Replacement of the heating utility with steam generated from bagasse.
Superheated steam generated from bagasse at a pressure of 2.83 MPa and 350 °C is available. Its use for power generation allows taking full advantage of the sugarcane life cycle, minimizing waste and contributing to a circular economy [24]. The flow of this steam in kg/h is sufficient to cover the heating demand of the cold streams identified in the ethanol production plant and has a price of 2.5·10-6 USD/kJ. The power plant that produces this steam is located near the ethanol production facility, in the sugarcane-milling factory, without energy integration until now.
Results
An optimum ΔTmin of 10 °C was selected for both cases, since the lowest total cost is obtained for this one, as shown in Figures 3 and 4. For the study of the relationship between these variables, an interval of 10 °-20 °C was used, since it is within the recommended limits reported in the literature for chemical industries (10° -20 °C) [7]. The study was performed for a step of 1 °C in order to obtain more precision in the reading of the results. The ΔTmin initially estimated was found to be the optimum ΔTmin. The ΔTmin of 10 °C, in this case, expresses the best compromise between the auxiliary services requirements, the heat exchange area, and the number of shells of the unit; this value, in turn, delimits the most restricted region for heat recovery.
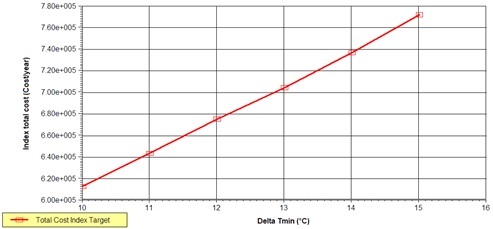 Figure 3.
Optimization of
the ΔTmin case A
Figure 3.
Optimization of
the ΔTmin case A
Source: Authors’ own
creation.
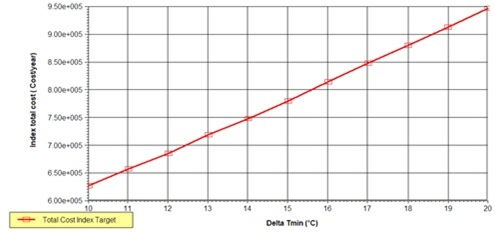 Figure 4.
Optimization of
the ΔTmin case B
Figure 4.
Optimization of
the ΔTmin case B
Source: Authors’ own
creation.
Composite curves for cases A and B were obtained through Pinch analysis, using a global minimum ΔT of 10 °C. These curves, shown in Figures 5 and 6, respectively, represent the heating and cooling demand of the system. The closest distance between the two curves indicates the ∆Tmin, i.e., the minimum driving force for heat exchange, while the overlapping area defines the Maximum Energy Recovery (MER). This tool enabled the identification of key energy targets: in case A, the minimum heating demand was 1.77·10⁶ kJ/h, and the cooling demand was 2.92·10⁷ kJ/h; in case B, the minimum heating and cooling demands were 1.691·10⁶ kJ/h and 2.93·10⁷ kJ/h, respectively.
The Pinch point, defined as the point of closest approach between the composite curves, was identified in both cases at temperatures of 80 °C (hot stream) and 70 °C (cold stream). This point is critical for heat exchanger network design, as it sets the thermal boundaries beyond which no further energy recovery is possible without auxiliary utilities. Therefore, the network must be designed to avoid heat transfer across the Pinch point, respecting the natural direction of thermal flow and optimizing energy integration throughout the process.
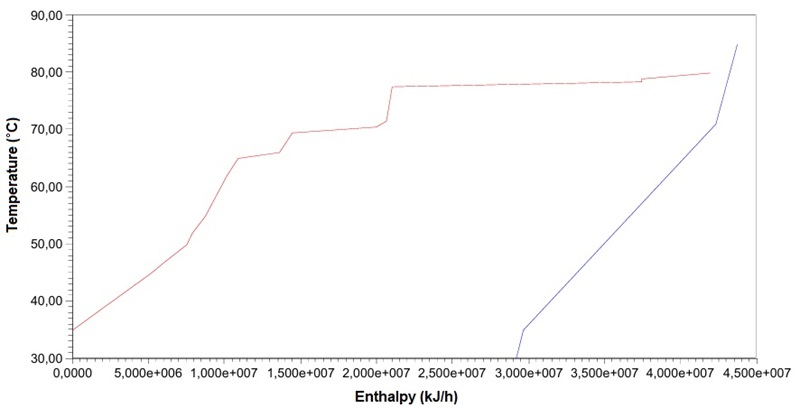 Figure 5.
Composite curves
case A
Figure 5.
Composite curves
case A
Source: Authors’ own creation.
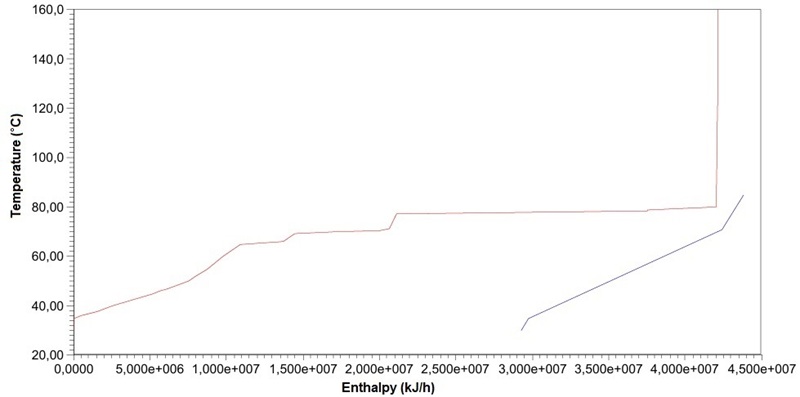 Figure 6.
Composite curves
case B
Figure 6.
Composite curves
case B
Source: Authors’ own
creation.
Using the “recommend design” option, the tool generated four heat exchanger network designs for both case A and case B, each satisfying the energy requirements of the process. The main differences among these designs lie in their proximity to the total annualized cost of the optimal configuration. Design 2 was selected for case A (Figure 7) and design 3 for case B (Figure 8), as they are the closest to the energy and economic targets, thus representing a better utilization of available energy.
These selected designs achieve energy recovery rates above 60% of the available energy in the process. The remaining designs for each case show energy recovery rates above 40%. However, the main limitation of the non-selected designs is the considerable increase in the number of heat exchangers required, which raises the capital cost. Specifically, in design 2 of case A and design 4 of case B, the connections generated by the software do not account for the full utilization of stream C8.
In the grid diagram, the blue color represents the cooling, the red color represents the heating, and the gray color represents the heat exchanger as a process-to-process heat exchanger. The splits/branches in the process flow will always converge back into a single arrow flow. The convergence of the branches indicates a mixer in the process stream.
Design 2 proposes 12 heat exchangers, of which one handles exchange between process streams. Design 3 proposes 16 heat exchanger units, of which one handles exchange between process streams. Stream F2 covers part of its heating demand by supplying the cooling demanded by stream C7, in both cases.
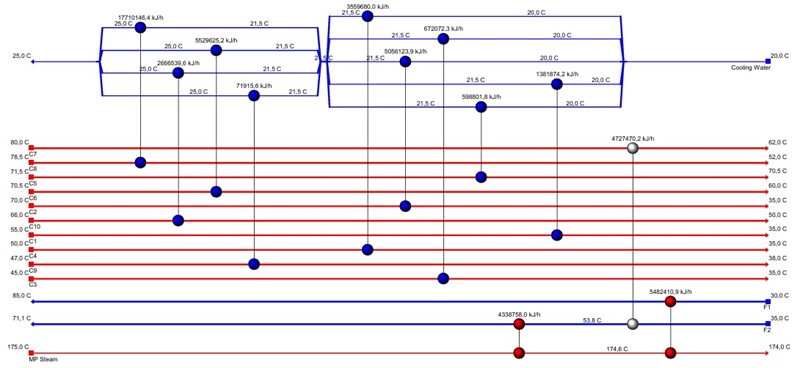 Figure 7.
Design 2 case A
Figure 7.
Design 2 case A
Source: Authors’ own creation.
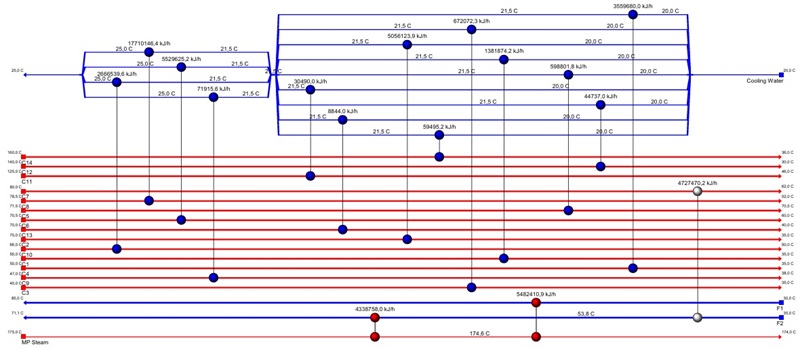 Figure 8.
Design 3 case B
Figure 8.
Design 3 case B
Source: Authors’ own creation.
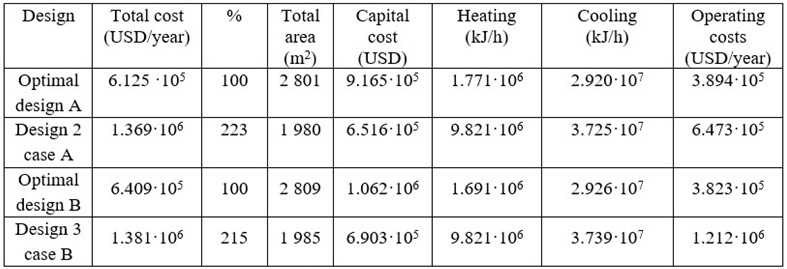
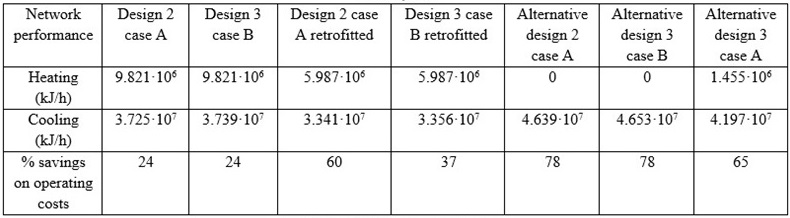
Table 5 shows the results obtained for these designs and compares them with the optimum design for each case.
Table 5.
Comparison between designs
Source: Authors’ own
creation.
The “optimize design” feature in Aspen Energy Analyzer was applied, which allows adjusting parameters to reduce the total annualized cost or maximize the heat exchange area. However, in this study, the tool did not yield significant improvements in the resulting designs. This is because the proposed configurations had already been refined by the researcher using technical and economic criteria to maximize energy recovery within the process constraints. As a result, when these designs were subjected to the optimization tool, no additional tangible benefits were identified. The tool was used as a verification step to rule out further improvements, which does not imply that its application must necessarily lead to superior results in every case.
For the new designs, the proposed improvement alternatives are studied, since the total annualized cost is twice as high as this indicator in the optimal design.
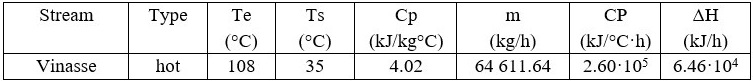
Alternative 1
The vinasse streams have been demonstrated to reduce the demand for heating services. The inlet temperature of this stream is high, and it complies with the minimum temperature difference (ΔTmin) requirement. Furthermore, the outlet temperature of this pollutant is reduced by utilizing its energy. For cases A and B, new designs were explored and are shown in Figures 9 and 10. The hot and cold Pinch temperatures appeared in both cases at 108 °C and 98 °C, respectively.
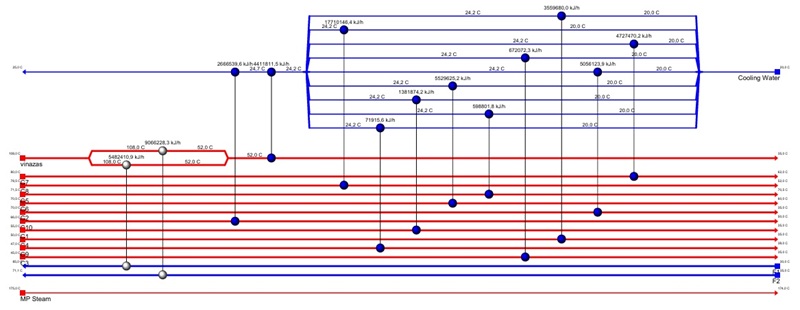 Figure 9.
Alternative
design 2 case A
Figure 9.
Alternative
design 2 case A
Source: Authors’ own creation.
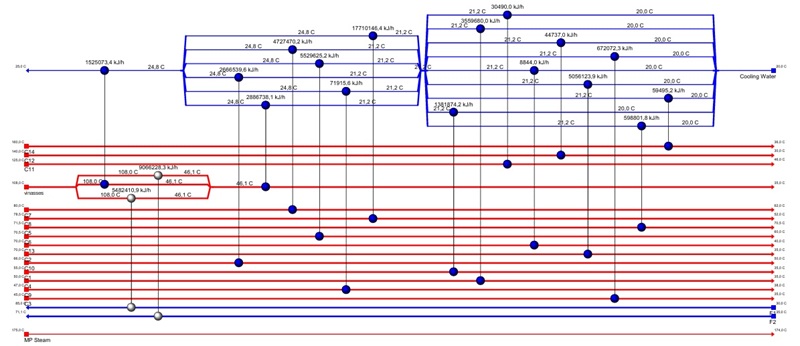 Figure 10.
Alternative design
3 case B
Figure 10.
Alternative design
3 case B
Source: Authors’ own creation.
Design 2 case A proposes 13 units, and Design 3 case B proposes 18 heat exchanger units. In both, two exchangers handle the exchange between the process streams. The stillage stream is branched to fully satisfy the energy demands of F1 and F2. The new designs obtained for both cases represent a savings in auxiliary services purchase costs of USD 1,252,120/year.
Alternative 2
The networks obtained for each case can be modernized in order to obtain greater energy savings; this is done through the "modernization" option of the Aspen Energy Analyzer tool. For Design 2 case A and Design 3 case B, only the modernization by adding a heat exchanger is applied.
For Design 2, case A, it was found that the highest energy savings are represented by Design 2-3, which proposes a new heat exchanger between the F1 and C7 streams; this is shown in Figure 11. For Design 3, case B, the greatest energy savings are represented by Design 3-3, which proposes a new heat exchanger between the F1 and C8 streams; this is shown in Figure 12. In the figures, the new heat exchangers are shown in green.
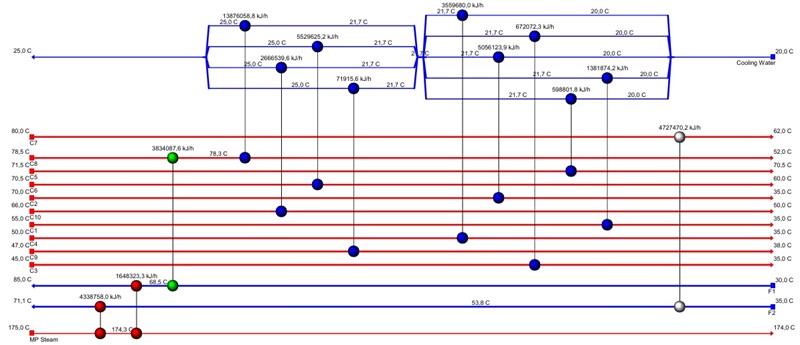 Figure 11.
Alternative
design 2-3 case A
Figure 11.
Alternative
design 2-3 case A
Source: Authors’ own creation.
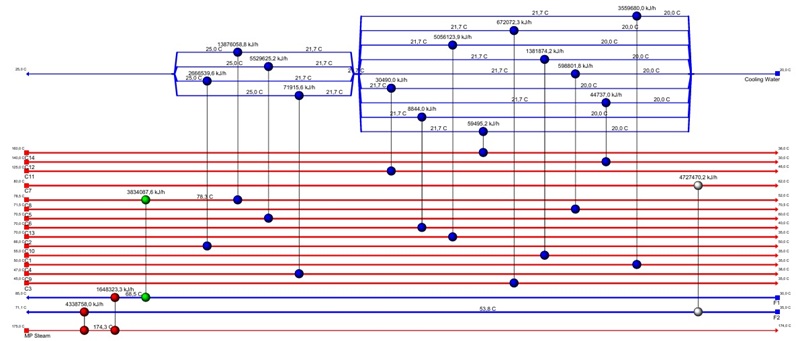 Figure 12.
Alternative design 3-3 case B
Figure 12.
Alternative design 3-3 case B
Source: Authors’ own creation.
Both designs represent a savings of 977,736 USD/year for the purchase of auxiliary services.
Alternative 3
The potential for cost savings in auxiliary services expenses is examined through the utilization of surplus steam from the sugar production facility. This analysis is conducted as part of a broader program that explores alternative auxiliary heating service options. The study was carried out for case A, since the incorporation of the CO. plant does not imply additional steam consumption.
The software generated a single design that fully covers the heating demand using the surplus steam from the power plant. Figure 13 shows the design obtained.
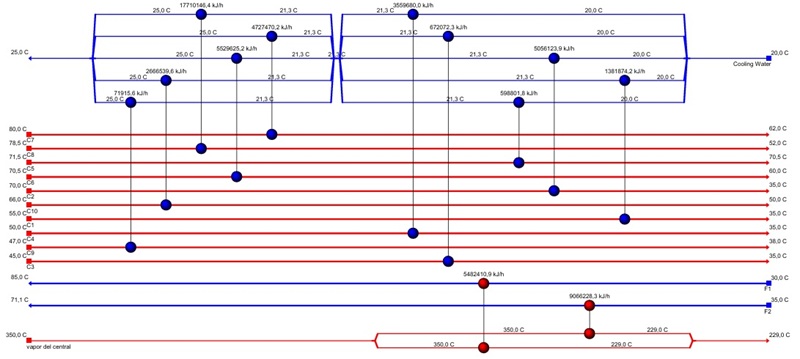 Figure 13.
Alternative design 3 case A
Figure 13.
Alternative design 3 case A
Source: Authors’ own creation.
This design proposes an area of 1,781 m. and 12 heat exchange units, which represents a savings of 1,044,803 USD/year.
Table 6 presents a summary of the improvement possibilities studied, using as a baseline the current auxiliary service costs generated by the plants under study.
Table 6.
Analysis
of improvement alternatives with respect to the costs generated by current
auxiliary service consumption.
Source: Authors’ own creation.
In the alternative designs generated, similar results are obtained for both cases (A and B), but all savings are exclusively associated with changes in the ethanol production plant. It is observed that integration between the ethanol and CO₂ plants is not feasible, as none of the proposals show that case B generates higher revenues than case A. This disparity is primarily due to the CO₂ plant lacking available cold streams, which significantly limits its energy integration potential. Additionally, its hot streams require minimal cooling compared to the thermal demands of the ethanol plant streams. In contrast, case A offers a greater availability of thermally active streams, enabling better energy recovery, increased flexibility in heat exchanger network design, and more effective reduction in auxiliary service consumption. From an economic standpoint, this integration capacity translates into lower operating costs and greater financial feasibility of the proposed design.
Conclusions
Pinch analysis application, using the Aspen Energy Analyzer software, has allowed obtaining important energy objectives that demonstrate the possibility of improving the current exchange networks through the exchange between process streams and the use of residual streams such as stillage, with savings from 24% to 78% with respect to the current expenditure on auxiliary services.
Beyond the technical outcomes, this study underscores the replicability of the approach in other agro-industrial processes that share similar characteristics in terms of thermal stream availability and energy integration opportunities. However, implementing such solutions in real industrial settings may face key barriers, including the required capital investment to modify or expand existing infrastructure, the training of technical personnel in simulation and energy analysis tools, and the availability of accurate operational data for process streams.
References
[1] D. A. Fornet and J. D. Fornet, "Gestión de procesos con enfoque ambiental en la industria azucarera “14 de Julio”, Cuba," Revista Científica Episteme & Praxis, vol. 1, no. 3, pp. 29-40, 2023.
[2] M. Cortés, S. Álvarez, Y. Martínez, Y. Carvajal, M. Zamora y V. Morales, "Análisis exergético de escenarios integrados de producción de etanol y otros productos a partir de la caña de azúcar", Afinidad,vol. 74, no. 578, 2017. [Online]. Available: https://www.raco.cat/index.php/afinidad/article/view/326523.
[3] J. Touset, L. López y L. Díaz, "Evaluación del desempeño energético y la recuperación del calor en una refinería de azúcar: e337", Revista Cubana de Ingeniería, vol. 13, no. 3, 2022. [Online]. Available: https://rci.cujae.edu.cu/index.php/rci/article/download/848/538.
[4] B. Correia, H. Matos, T. Lopes, S. Marques, and F Gírio, "Sustainability Assessment of 2G Bioethanol Production from Residual Lignocellulosic Biomass," Processes, 12, 987, 2024, https://doi.org/10.3390/pr12050987
[5] Fang Liu, Xiang Guo, Yuan Wang, Guanyi Chen, Li’an Hou J, "Process simulation and economic and environmental evaluation of a corncob-based biorefinery system Journal of Cleaner Production, 329, 20 December 2021, 129707
[6] Fansuri, H., Purwandari, U., Putra, S., Adhiksana, A., Junianto, I.D., Oktavian, R., and Cordiner, J. (2024), A Review of the Technological Aspects and Process Optimization of Bioethanol Production From Corn Stover Biomass: Pretreatment Process, Hydrolysis, Fermentation, Purification Process, and Future Perspective. Qual Manage., 34: e22336. https://doi.org/10.1002/tqem.22336
[7] A. dos Santos, A. Moraes e M. E. Torres, "Estudo da análise Pinch aplicada à indústria de álcool", Curso de Engenharia Química, Universidade São Francisco, Campus Swift, 2017. [Online]. Available: https://lyceumonline.usf.edu.br/salavirtual/documentos/2973.pdf
[8] J. Klemeš, P. Varbanov, S. Alwi, Z. Manan, Y. Van Fan, and H. H. Chin, Sustainable process integration and intensification: saving energy, water, and resources, Third ed. USA: De Gruyter, 2023, p. 392.
[9] S. Formann et al., "Beyond sugar and ethanol production: value generation opportunities through sugarcane residues," Frontiers in Energy Research, vol. 8, p. 579577, 2020.
[10] E. Aas, "Optimization of heat exchanger networks using Aspen Energy Analyzer and SeqHENS," Master’s thesis, Chemical Engineering, Norwegian University of Science and Technology, 2019. [Online]. Available: https://ntnuopen.ntnu.no/ntnu-xmlui/bitstream/handle/11250/2639395/no.ntnu%3Ainspera%3A2526883.pdf?sequence=1
[11] M. Behrouzi, "What is Aspen Energy Analyzer and how does it function?" [Online]. Available: www.linkedin.com/posts/mohammadrezabehrouzi_what-is-aspen-energy-analyzer-and-how-does-activity-7079736421262991360-5JXj
[12] R. H. Hafyan et al., "Integrated biorefinery
for bioethanol and succinic acid co-production from bread waste:
Techno-economic feasibility and life cycle assessment," Energy Conversion and Management, vol.
301, p. 118033, 2024, doi: https://doi.org/10.1016/j.enconman.2023.11803.
[13] L. Sánchez, "Integración energética y diseño de intercambiadores de calor para una planta Lurgi con 100 t/h de producción de metanol", Trabajo de fin de grado, Facultad de Ciencias, Universidad de Santiago de Compostela, 2022.
[14] M. Alio, A. Marcati, A. Pons, and C. Vial, "Modeling and simulation of a sawdust mixture-based integrated biorefinery plant producing bioethanol," Bioresource technology, vol. 325, p. 124650, 2021, doi: https://doi.org/10.106/j.biortech.2020.124650.
[15] I. Kemp, Pinch Analysis and Process Integration, Second ed. USA: Elsevier, 2020, p. 415.
[16] A. Alvarez, J. Á. Llanes, I. Cortés y C. Perdomo, "Determinación de los coeficientes de transferencia de calor en calentadores de jugo de caña", Revista Centro Azúcar, vol. 46, no. 1, p. 9, 2019. [Online]. Available: http://centroazucar.uclv.edu.cu/index.php/centro_azucar/article/view/45.
[17] O. Pérez Ones, J. Díaz Rodríguez, L. Zumalacárregui y O. Gozá León, "Evaluación de propiedades físicas de mezclas etanol-agua (II)," Revista Facultad de Ingeniería Universidad de Antioquia, no. 52, pp. 62-74, 2010.
[18] E. Penín, "Propuestas de alternativas de mejoras tecnológicas en la destilería ALFICSA", Tesis de maestría, Facultad de Química-Farmacia, Universidad Central "Marta Abreu" de las Villas, 2016.
[19] M. Figueroa "Evaluación de esquemas de integración material y energética de las plantas de derivados de la Empresa Agroindustrial Azucarera (EAA) “Antonio Sánchez", Trabajo de Diploma para optar por el título de Ingeniero Químico, Universidad Tecnológica de la Habana José Antonio Echeverría, La Habana, 2023.
[20] S. Boldyryev, G. Krajačić, and N. Duić, "Cost effective heat exchangers network of total site heat integration," Chemical Engineering Transactions, vol. 52, pp. 541-546, 2016.
[21] Aspentech. "Aspen Energy Analyzer. Tutorial Guide." [Online]. Available: https://esupport.aspentech.com/S_Article?id=000061531.
[22] L. Hegely and P. Lang, "Reduction of the energy demand of a second-generation bioethanol plant by heat integration and vapour recompression between different columns," Energy, vol. 208, p. 118443, 2020.
[23] M. Muharja et al., "Heat Exchanger Network
(HEN) Analysis of The Power Plant Industry Using Aspen Energy Analyzer
Software," ASEAN Journal of Chemical
Engineering, vol. 23, no. 1, pp. 14-27, 2023.
[24] T. Raj et al., "Recent advances in
commercial biorefineries for lignocellulosic ethanol production: Current
status, challenges and future perspectives," Bioresource technology, vol. 344, p. 126292, 2022.
Notas
*
Research article
Notas de autor
a Corresponding author. E-mail: osney@quimica.cujae.edu.cu
Información adicional
How to cite this article: S Pérez Cedeño, L Zumalacárregui
de Cárdenas, O Pérez Ones, A Cruz Llerena, “Application
of Process Integration Techniques in Sugar Industry By-Product Plants” Ing. Univ. vol. 30, 2026. https://doi.org/10.11144/Javeriana.iued30.apit


 (1)
(1) (2)
(2) (3)
(3) (4)
(4) (5)
(5)